
There could be surprising situations where the AppInsight->Servers page show high rate of Exceptions but when we query exceptions it will not match with the exception rate. Its is tough situation for supporting application especially when stakeholders are interested in AppInsight reports.
If the production support teams are not capable of finding out why the different occurs, it will come to development. So what is going on here?
Why EXCEPTION RATE is not the rate of exceptions telemetry?
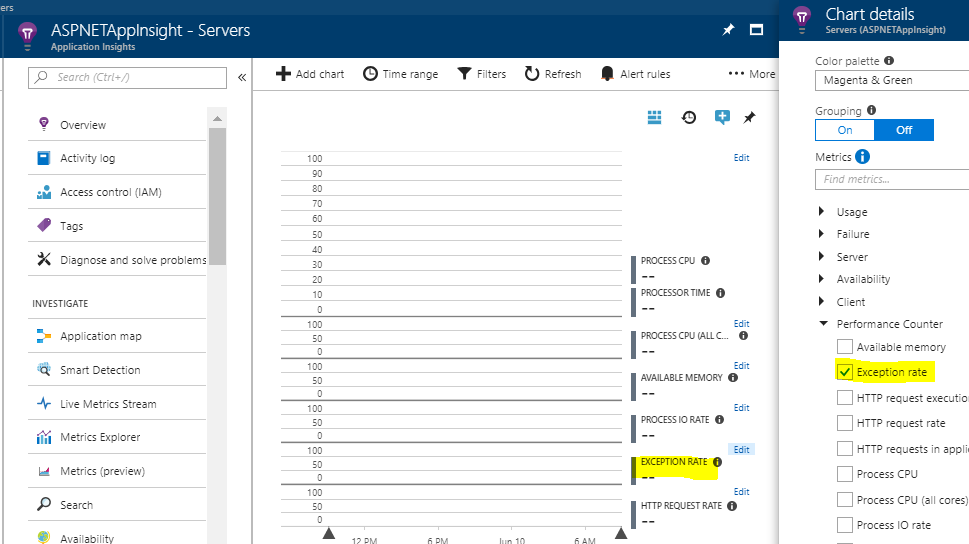
The AppInsight->Servers page displays the "EXCEPTION RATE" graph from performance counter where the 'exceptions' telemetry is having only the exceptions which are reported to AppInsight from applications such as using TrackException() of SDK. If application or framework is eating exceptions those exceptions will be affecting the performance counter and the graph but never comes into the exceptions telemetry. We can verify by clicking edit button of "EXCEPTION RATE" to view the data element. It will be performance counter. See the image below.
What are the sources of eaten exceptions?
The million dollar question is whether I should worry about this high exception rate? The answer is yes if we care about our software what we made. If the app is just working and its not mission critical and have enough budget to run the app, we may leave. But that is not the case with most of the applications especially if it is hosted in Azure. Every fault translate to money. If those exceptions are slowing down requests the entire throughput will get reduced which leads to more machines to serve less users.
OK, we are going to fix it. How to find out the sources of exceptions. As we seen in above section, perfmon.exe is a good start to find what processes are throwing exceptions. Once we know the source the fix depend on individual finding. Below are some examples
- If we are using netNamedPipe binding to communicate between internal services, there are high chance that so many exceptions got eaten by that binding but functionality would be working.
- If the system is consuming other Azure services and retry is implemented, there could be exceptions but retry might have solved the business scenario but the performance counter get affected by the exception.
- If there are any background workers running using 'On Error Resume Next' style, the exceptions encountered inside those may be eaten and affecting exceptions performance counter.
It is better to report the exception using TrackException even though we are handling it. Overall it is a tedious process but there are chances to get treasures which help us to remove one server to support same number of users.
Happy debugging.

No comments:
Post a Comment