Showing posts with label Observability. Show all posts

Monday, February 12, 2024

[Video] Azure @ Enterprise - Adding reference line to App Insights charts

We may present KQL-generated charts to managers to show that the production is working fine, especially to show the system responds to web requests within time. If the managers are still hands-on they easily understand whether this report looks good. Sometimes particular projects may have higher performance standards than the industry standards. Also, there may be more complex metrics than just the request response time. In all these situations it is better to add a reference line to show when it is considered a problem.

Here is the way to add such a line in a short video

https://youtube.com/shorts/Vpk7L6KY2Eo?si=z7Tkts_dsek4kPam

Tuesday, August 15, 2023

Azure @ Enterprise - Configuring PnP.Framework SDK logs to trace file

Context

Environment - Microsoft Azure Virtual Machines

Technology - .Net Framework 4.8, SharePoint Online

Functionality - Interacting with SharePoint Online via Graph SDK and PnP.Framework, Mainly uploading a large number of files.

Requirement - Trying to collect the logs emitted by PnP.Framework especially the HTTP calls.

Solution

The PnP.Framework emits the traces by default using the standard .Net Trace class. Note it is not the ILogger that is now the standard after .Net Framework. Refer to the source code to ensure they change in the future. There is an ILogger class involved but that is not the same .Net Core uses. 
  • .Net Core programming model - Microsoft.Extensions.Logging.ILogger & Microsoft.Extensions.Logging.ILogger<TCategoryName>
  • PnP.Framework - PnP.Framework.Diagnostics.ILogger
The default implementation of PnP.Framework is using TraceLogger class which is implemented by the same SDK. It uses the Trace class as mentioned above. So if we don't configure anything else, we can collect the logs to a file using the below configuration changes in app.config or web.config.
<system.diagnostics>
    <trace autoflush="true" indentsize="1">
      <listeners>
        <add name="Listener1" type="System.Diagnostics.TextWriterTraceListener" initializeData="path\to\file.ext" />
        <remove name="Default" />
      </listeners>
    </trace>
... 
</system.diagnostics>

Here ends the basic solution to the problem. Anytime PnP.Framework SDK logs it will be saved to the file mentioned in the <listeners> section.

Log Level

By default the PnP.Framework logs at 'debug' which is strange.
But that can be changed with some adjustments. Config changes goes below
<configSections>
    <sectionGroup name="pnp">
      <section name="tracing" type="PnP.Framework.Diagnostics.LogConfigurationTracingSection,PnP.Framework"/>
    </sectionGroup>
  </configSections>
  <pnp>
    <tracing logLevel="Debug">
    </tracing>
  </pnp>

Tuesday, March 28, 2023

Azure @ Enterprise - Writing custom functions in LogAnalytics KQL

Normally when we analyze web requests we encounter scenarios where the URLs have values such as GUID. That will cause little trouble when we want to aggregate. Without replacing those values if we aggregate, it will be showing many categories based on the cardinality of values. For example, if we are taking the max time taken by URL, it may be showing a different URL when with the GUID values and without GUID values.

In Azure world, we mainly use LogAnalytic, Application insights, etc... for storage and the Kusto Query Language (KQL hereafter) for querying data. The same problem of numbers and GUIDs in URLs will be a problem here as well.

The title of this post is not about replacing GUIDs using regular expressions. But the replacement of GUIDs is going to be demonstrated using a custom function in this post

Without GUID removal

Let us see a sample without filtering GUIDs


With GUID removal

Here goes the result of the GUID removal
In the above example we can see when we replace the GUID values, a new URL showed up. This is useful to decide what URL to optimize when we have limited time in hand.

GUID removal with function 

First, have an understanding of how to write user-defined functions in KQL and the difference between scalar and tabular functions.

Below goes the equivalent code with the function that replaces GUID values with string /GUID.

Tuesday, March 7, 2023

Azure @ Enterprise - Application Insights string split to find distinct databases from dependencies telemetry

Problem

We have access to the application insights of a distributed application. We don't have access to the server's inventory. But we need to get the database count and names.

This looks like a fresher interview question but this kind of scenario can happen in a real work environment. There is always a reason for asking these questions in fresher interviews.

Solution

It may feel easy as below Kusto query. The database names are in the 'dependencies" telemetry table.

Tuesday, June 12, 2018

Azure @ Enterprise - AppInsight -> Server -> Exception rate is not correlating with exceptions telemetry

There could be surprising situations where the AppInsight->Servers page show high rate of Exceptions but when we query exceptions it will not match with the exception rate. Its is tough situation for supporting application especially when stakeholders are interested in AppInsight reports.

If the production support teams are not capable of finding out why the different occurs, it will come to development. So what is going on here?

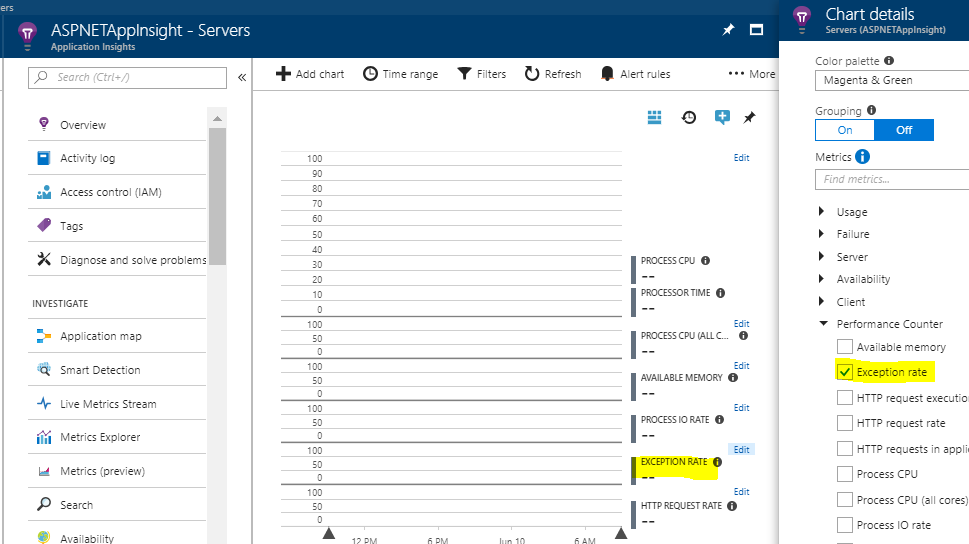
Why EXCEPTION RATE is not the rate of exceptions telemetry?

The AppInsight->Servers page displays the "EXCEPTION RATE" graph from performance counter where the 'exceptions' telemetry is having only the exceptions which are reported to AppInsight from applications such as using TrackException() of SDK. If application or framework is eating exceptions those exceptions will be affecting the performance counter and the graph but never comes into the exceptions telemetry. We can verify by clicking edit button of "EXCEPTION RATE" to view the data element. It will be performance counter. See the image below.
We can cross check by remote login into the server and watch the counter in perfmon.exe utility. This behavior is documented by Microsoft here and here.

What are the sources of eaten exceptions?

The million dollar question is whether I should worry about this high exception rate? The answer is yes if we care about our software what we made. If the app is just working and its not mission critical and have enough budget to run the app, we may leave. But that is not the case with most of the applications especially if it is hosted in Azure. Every fault translate to money. If those exceptions are slowing down requests the entire throughput will get reduced which leads to more machines to serve less users.

OK, we are going to fix it. How to find out the sources of exceptions. As we seen in above section, perfmon.exe is a good start to find what processes are throwing exceptions. Once we know the source the fix depend on individual finding. Below are some examples
  • If we are using netNamedPipe binding to communicate between internal services, there are high chance that so many exceptions got eaten by that binding but functionality would be working.
  • If the system is consuming other Azure services and retry is implemented, there could be exceptions but retry might have solved the business scenario but the performance counter get affected by the exception. 
  • If there are any background workers running using 'On Error Resume Next' style, the exceptions encountered inside those may be eaten and affecting exceptions performance counter.
It is better to report the exception using TrackException even though we are handling it. Overall it is a tedious process but there are chances to get treasures which help us to remove one server to support same number of users.

Happy debugging.

Tuesday, August 29, 2017

Azure Application Insights - End to end correlation from Angular to internal WCF services

Azure AppInsights is one of the PaaS offering which can be easily configured to our application and leverage capabilities. And it really works without any changes in our application. But does it helps us more than any other tools? May be yes with default setup. We will really love it if we can get end to end correlation to understand what is happening in our system. Production debugging will be a breeze with correlation. 

This post is talking about how can we correlate activities happening in different tiers of our system and see it in one place. Lets take a scenario where an Angular application is interfacing with users, it calls ReST endpoints to talk to front end services and front end services communicate with other internal services. We can correlate operations originating from client side to related operations happening in the internal services.

Prerequisite

  • Basic knowledge about AngularJS 1.x
  • Knowledge about WCF services.
  • Knowledge about setting up AppInsights service

Sample setup

It is advised to download the sample from below location before reading further. Below goes the structure of sample.

AngularJS application just does one thing. Finding the area of circle if we give radius. For finding area, it calls a ReST web service.
It sends one event during startup. Another one during calculating the area ie when calling the FronEndWCFService. These are custom AppInsights events

FronEndWCFService is a simple WCF service hosted using webHttpBinding to get ReST end points. It calculates the area using the parameter radius. It don't know the value of pi. It dependent on InternalService to get the value of pi. During the calculation it sends some custom events/operations to AppInsights.

InternalService is hosted using net.pipe binding. It has one method which returns the value of Pi. It also sends some custom events to AppInsights.

The above 3 components are hosted inside IIS and enabled with AppInsights for default system events.

Running the sample

  • Make sure the 3 web applications are hosted in IIS.
    • The web application has to net.pipe binding to host InternalService.
    • Try to browse the service Urls.
  • Give the Url of InternalService in the web config of FrontEndWCFService so that it can call.
  • Obtain AppInsights instrumentation key by either creating a new instance in Azure or copy from existing AppInsights instance. Replace this key into web applications. Better use visual studio search and replace and the word to replace with key is {Your Key} .There are 3 files to get the instrumentation key. 
    • /AngularClient/Views/Shared/_Layout.cshtml
    • /FrontEndWCFService/ApplicationInsights.config
    • /InternalService/ApplicationInsights.config
  • Run the AngularClient application in browser.
    • During the application load, it will log "Custom init event from JS"
    • When we give the radius in the text box and click on button it will log "Custom event from JS before service call"

Viewing the AppInsights

It may take some time to get the entries reflected in the AppInsight in the Azure portal. It is better to go to the analytics portal of ApplicationInsight instance and view the results. In the analytics portal, the details can be seen as follows.

The entries highlighted in the name column are the custom events generated by different tiers in the system. Along with custom events the system will generate event if AppInsights collectors are attached to the processes. That can be done by connecting interceptors in the WCF or HttpModules in Web request pipelines.

Understanding correlation results

The operation_id column is the id which really correlate the operations. The id has to be unique and the parent_id can be any id used previously. It can be a tree of related events.

Don't get confused on the term 'events' used here. AppInsight can accept events, operations, traces etc...For easy reference term event is used.

Q&A

How does a web request from Angular gets correlated with servers

When we send web request from Angular or any client if we send http header "Request-Id" it will be treated as operation_id by server side, if we have the AppInsight request interceptors

Why the sample has 2 methods in Angular to write custom AppInsights

When the application is getting initialized, the appInsights object may not have the context ready.If so we have to put into queue. Once the context is initialized, we can use it to set operation_id. At that point the queue will be null.

Should I write any code for intercepting incoming web/WCF requests to read correlation data?

No we just need to use already available nuget packages and setup our web.config appropriately.

Should I write any code for intercepting the out going web/WCF requests to write correlation data?

No we just need to use already available nuget packages and setup our web.config appropriately.

References

https://docs.microsoft.com/en-us/azure/application-insights/application-insights-correlation
https://github.com/Azure/diagnostics-correlation
https://github.com/Microsoft/ApplicationInsights-JS
https://github.com/aspnet/Microsoft.AspNet.TelemetryCorrelation
https://mitra.computa.asia/article/msdn-modifying-and-filtering-telemetry-appinsights-javascript-sdk-telemetry-initializer