Showing posts with label Wireshark. Show all posts

Tuesday, August 13, 2019

System.Diagnostics logging in .Net - Trace sources

As developers, we often need to work with network issues. The first step is to finding out there is a network issue such as delay or package loss. This can be found by looking at Wireshark. But Wireshark needs some expertise. Also, it needs installation and mostly a restart after installation. When working in production environments it would be difficult to restart. But the other side is we can analyze without any changes to the application as setting diagnostics source needs application config changes.
But if we just consider the expertise needed for Wireshark, a better way is to collect some svc logs using Diagnostics. If required go for Wireshark as the second step of the analysis.

Diagnostics sources related to Network

We are not going to create another list. Below are the links to already existing tutorials

General networking

https://docs.microsoft.com/en-us/dotnet/framework/network-programming/how-to-configure-network-tracing
https://blogs.msdn.microsoft.com/waws/2017/03/14/how-to-get-a-system-net-trace-of-your-c-web-job/

WCF

Legacy ASMX

Other diagnostic sources

Since diagnostics source tracing is .Net feature, there are other diagnostics sources as well useful in different scenarios. Below are some collections.

https://stackoverflow.com/questions/2464071/what-is-the-list-of-trace-sources-supplied-by-the-net-framework

Unfortunately, it seems there is no official link of the full list of trace sources.

Tuesday, June 25, 2019

Network capacity planning - Poor developer's tool

Background

We are about to perform load testing of a our application using a load testing tool say Visual Studio Team System or load runner. Before we initiate we need to plan the network capacity needed for full load. If the load testing environment is in a locked room air gaped with rest of network, this is not an big impact. But it is good to know, if we are running load test in same enterprise network with users and especially running the during the peak business hours. It looks wired but some people actually does this way.

Lets assume our application is simple web based single page application with some web apis. Both hosted in same web server(s)

Aim

Find out the total network payload between 2 machines/IPs for a specified time interval. This can be used to measure traffic to the application when load test scenarios are executed.

In this post, we are taking http://joymononline.in as the application to test

Tools

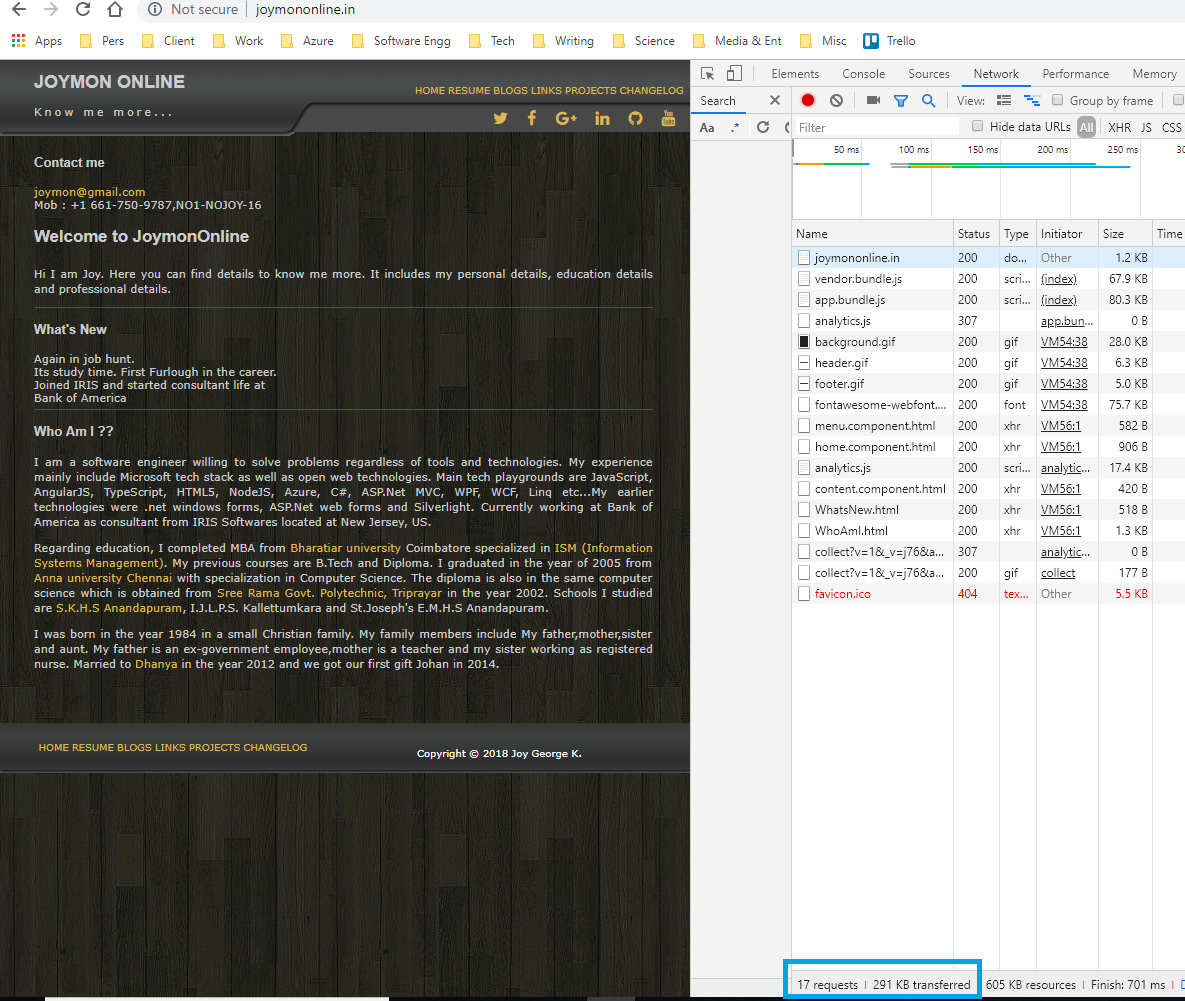
There are lot of tools. F12 can be seen as one. But F12 is not enough as it capture the http traffic. Other than http data, there are lot of handshaking and all happening to establish connection. 

Apart from http data size 291KB what is shown in above screenshot, we need to find out actual traffic.
Lets see how this can be done using Wireshark. 

How to measure using Wireshark

First we need to find out the IP of the application. In this scenario we can taking http://joymononline.in as the application to load test

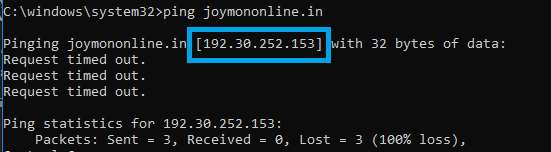
Finding the destination IP address

Simple if the target server supports ping. Below is a screenshot which does the same

Wireshark statistics

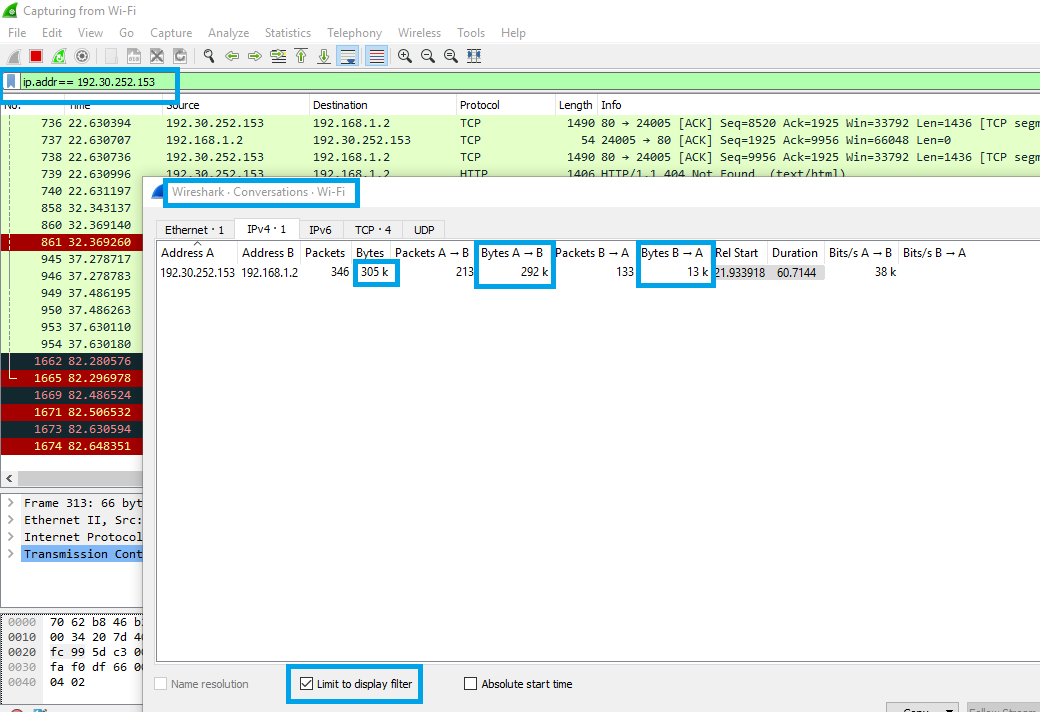
Wireshark has Statistics menu, that can show the conversations happened between 2 IPs. 

Below are the steps

  1. Run Wireshark. Make sure selecting the right network adapter. In this case its from Laptop with home broadband connected via WiFi.
  2. Filter the traffic by entering proper filter
  3. Do the operations. In this case just opened http://joymononline.in in browser
  4. Pause Wireshark
  5. Open Statistics->Conversations
  6. Check the "Limit to display filter" checkbox at the bottom left.
  7. Select IPv4.1 tab. (It really depend on the scenario what needs to be captured)
The Bytes shows total bytes transferred. in this case 305k the Bytes A->B and Bytes B->A shows the directional communications.

Measure traffic in load test scenario

In the real scenario to measure the traffic, the full scenarios / use cases of load test can be executed with single user once the Wireshark runs. If there are load generating agents, the Wireshark has to run there to capture traffic.

Interesting

Tuesday, June 4, 2019

SQL Server Browser Service - a view through wire

What is SQL Server Browser Service

It is a windows service which helps the clients by providing information about SQL Server instances running in the machine. For example, if a client knows only SQL instance name say server1\namedInstance2, the SQL Server browser helps the client to find the exact port number of named instance. Port number is needed to connect to the to the SQL Server Engine if it is using TCP to connect and uses non standard 1433 port.

How SQL Server Browser works?

SQL Server Browser works over UDP port 1434. It doesn't seems we can change that UDP port as it defeats the purpose of endpoint discovery. In short clients ask information about SQL Instance and browser service answers it.

Refer the Microsoft documentation for more details.

How SQL Server Browser looks like from Wireshark?

SQL Server browser activities can be seen through wire, if we have right network tools installed. Wireshark is the best tool to begin with and its widely popular for these type of exploring. It is free to use. There is already a great article which shows how it works over the wire. Link is below


It is assumed that the application to SQL Server communication would be via TCP as normally  as best practice applications and databases are placed in different machines. If the named pipes or shared memory is used, the troubleshooting will vary.

Wireshark to see SQL Server Browser failure

Normally on development environment the 1434 port would be open and SQL Server Browser running in SQL Server machine. If developers code based on that assumption, it may fail in higher environments. Most of the developers know what might have happened. But some may not and ends up in complete darkness. The symptom of this issue will be connection failure from application to SQL Server database.

This post is mainly to demonstrate how to check network failures on SQL Server Browser operations. The prerequisite is the availability of Wireshark in the machine where application runs and basic knowledge how to run the same. The above link has some screenshots which would help to run Wireshark for UDP connections.

The failure scenario can be confirmed by below steps.

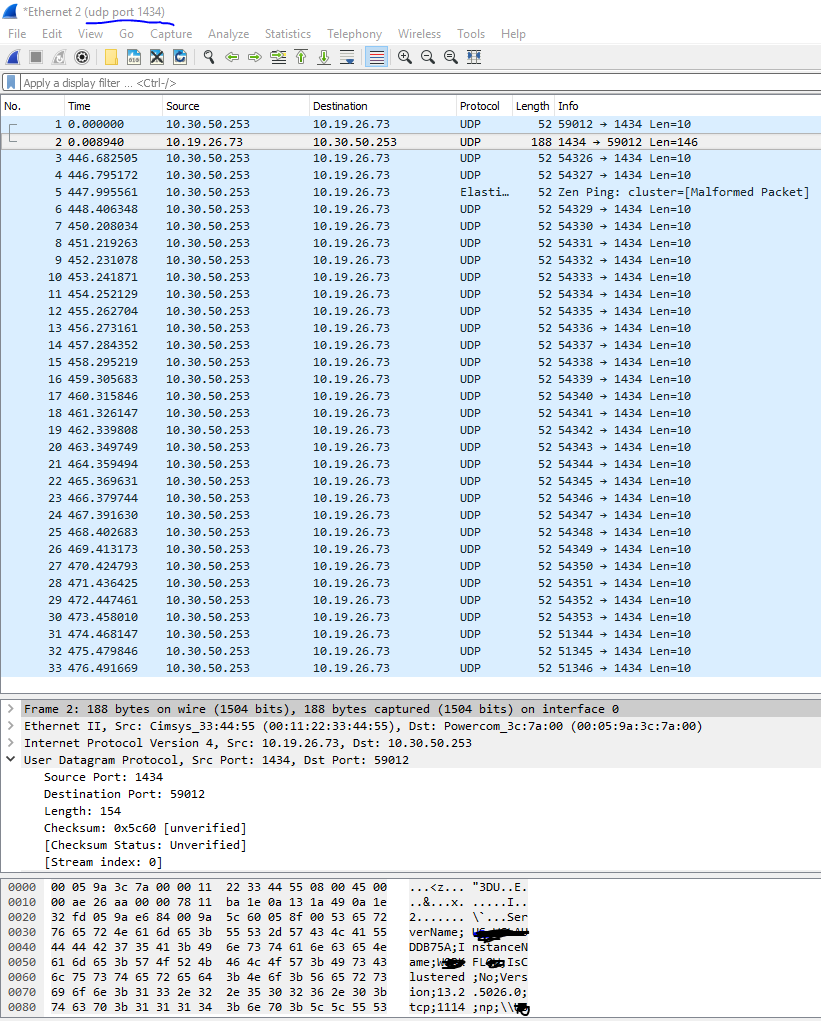
  1. Make sure the Wireshark is capturing UDP 1434 traffic in the machine where application runs.
  2. Reproduce the scenario. Better use SSMS or any test client tools to establish a connection than full application. Again if allowed to use SSMS or other tools in higher environments.
  3. If the UDP requests are made one after another like retry, there is an issue. Refer the screenshot below from the frames starting 3. The initial 2 frames shows the working scenario.
  4. The UDP will fail, if any of the below is true.
    1. The firewall rules blocks the port 
    2. The SQL Server Browser is not running in the SQL Server machine.

If the everything is in working state and the client application is not using specific TCP port to connect to SQL Server Instance, the client will get UDP response from server with the port number. Else it retries 30 times and times out.

We can easily filter the Wireshark logs if we already knows what is the SQL Server machine IP Address. The source would be the SQL Server machine IP and the destination application machine IP.

Caching the port number by client applications

The clients may cache the TCP port number what they got from UDP response. In such scenario based on the nature of the client, we may need to restart or wait for the cache expiry.

Similarly The SQL Server Browser might be stopped or communication is blocked in any other ways, during the normal working. If it happens, the old clients works but new clients don't. It is better to restart the clients to ensure there is connectivity.

https://stackoverflow.com/questions/53906521/where-is-the-cache-of-sql-server-browser-service-for-resolving-instance-names-p

References

https://docs.microsoft.com/en-us/sql/database-engine/configure-windows/troubleshoot-connecting-to-the-sql-server-database-engine?view=sql-server-2017
https://social.msdn.microsoft.com/Forums/sqlserver/en-US/d234c318-dead-4aab-bd2d-7c0cd8f4261a/sql-browser-and-1434-in-sql-server-2016?forum=sqldatabaseengine
https://www.mssqltips.com/sqlservertip/2436/what-does-my-sql-server-data-look-like-over-the-wire/