Showing posts with label Networking. Show all posts

Tuesday, January 16, 2024

Azure @ Enterprise - Postman to simulate api to api on behalf of flow

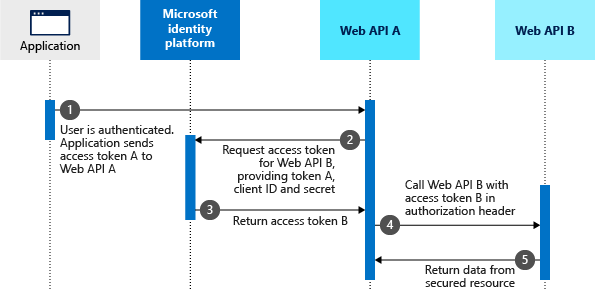
Often we encounter situation where we have one web api that needs to call another api as the incoming user. Basically our web api needs to impersonate the user to the next downstream api. Below goes the official diagram¹ from Microsoft.

Let us call the Web API A as middle tier API and Web API B as down stream api. Here we assume our application is an Angular web app.

Coding that auth flow is little complex. Before coding it is always good to understand how this can be done using Postman.

This require setting up Azure app registrations which are tricky to many developers. So we will detail those out. A glance of sample setup is below

  • Application
    • App registration (aad-testapp/b34ade37-*)
      • This app registration should have Postman's redirect url "https://oauth.pstmn.io/v1/callback"
      • This needs to have secret to be used from Postman
      • This should have permission to call aad-testapi1 with admin consent to avoid runtime individual user consent.
  • Middle tier web api (Web API A)
    • App registration (aad-testapi1/b6d5852b-*)
      • This should have secret to be used while asking for ob behalf of token
      • This should have permission to call aad-testapi2 with admin consernt to avoid runtime user consent.
  • Downstream api (Web API B)
    • App registration - (aad-testapi2/67d35db8-*)
      • No need to have certificates or secrets as this is not getting any token.
      • The expose and API section to have the aad-testapi1 to authorize and to avoid any consent
Once we have the above mental model, it would be easy to understand the relations. Below goes the screenshots for the above.

App registration for application (aad-testapp)


App registration for Middle tier api(aad-webapi1)

App registration for down stream api(aad-webapi2)


Now let us get into business of getting tokens

Getting First token A

This token is to talk between the client app and the middle tier API. This cane be done as normal way² in Postman.
We can use any url as we are not really making call to this web api. This token is used to obtain the ob behalf of token so that we can call the downstream api.

Set the Authorization to OAuth 2.0.
Now in the configure new token give the details as follows.

Here below 3 fields may attract queries. 

Let us details it, if the screenshot is not enough.

  • Auth Url - The url that ends with /authorize.
  • Access Token Url - The url that ends with /token.

These 2 urls can be seen if we take fiddler traces when the token is requested from Postman.

  • Scope - the scope to the aad-webapi1.
Once the values are set, click on the 'Get New Access Token' button. This will open a browser and ask for login. Once it is success it will redirect to the https://oauth.pstmn.io/v1/callback which will show a popup in browser to open Postman again. If all that is success Postman will show the new token.

This token we will be using as assertion in next step.

Getting on behalf of token B

Now we simulated the Angular client getting the token and it will be sending that in Authorization header. Let us simulate how the middle tier API going to get the on behalf of token using this token.

The url we are using is the normal token url of the tenant.
  • grant_type - no idea why it needs to be this string. It is as per the docs³. We normally expect this to be 'on_behalf_of', but it is not.
  • requested_token_use - here comes the word 'on_behalf_of'
  • client_id - is the id of middle tier app registration
  • client_secret - created in middle tier app registration
  • scope - poining to downstream api
  • assertion - this is the incoming token to middle tier api from the client application.
When we are coding in .Net we can use X509 certificate instead of client_secret
Click 'Send' button to get new token. This token can be used to call the downstream api.

Reference


Tuesday, January 9, 2024

Samba from Raspberry Pi - Rejected an insecure guest logon [Solved]

This post is about troubleshooting connectivity issues to Raspberry Pi when accessing an SMB shared path.

Context

The aim is to expose a NAS from Raspberry Pi using Samba. It should be accessible only with authentication. The good thing in Windows is that it disables the anonymous access by default¹.
For authenticating there is a user created in Raspberry Pi. Below is the design.

Problem

When accessing SMB share from Windows 10 machine, it error out with

"\\raspberrypi.lan is not accessible. You might not have permission to use this network resource. Contact the administrator of this server to find out if you have access permissions.

You can't access this shared folder because your organization's security policies block unauthenticated guest access. These policies help protect your PC from unsafe or malicious devices on the network."

The event viewer shows the below.

Rejected an insecure guest logon.

User name: <user name>

Server name: \raspberrypi

Guidance:

This event indicates that the server attempted to log the user on as an unauthenticated guest and was denied by the client. Guest logons do not support standard security features such as signing and encryption. As a result, guest logons are vulnerable to man-in-the-middle attacks that can expose sensitive data on the network. Windows disables insecure guest logons by default. Microsoft does not recommend enabling insecure guest logons.

Analysis

It says the attempt is made as an unauthenticated user. But the dialog box for login was present and entered the username and password.

Root cause

The credentials were wrong. When the password was wrong, instead of telling wrong user name or password, it fall back to unauthenticated anonymous user access and that is rejected.

Why it takes that fall back?

It is bacause of a setting in Samba. The setting name is "map to guest". The default value is 'Never'² but the value was somehow different.

Solution / Fix

Make sure the smb.conf has "map to guest user" = 'never', if we want to enforce only authenticated users accessing the share. May be we can leave it as the default value is 'never'.

More more details refer Ansible scripts³ in previous post in this blog.

Happy debugging...

References

Tuesday, August 1, 2023

Raspberry Pi - Why my NAS (via SMB) is slow

Problem

As seen below, when I want to move files to and from my NAS, I DIYed. It was a little better before I moved to the new house.

Specs

  • Raspberry Pi 4 4GB is hosting the NAS
  • Both RasPi and client Windows machines are in WiFi 5 (In the old 1BHK apartment all were nearby and used LAN cable)
  • RasPi is hosting another service such as Plex.
  • Seagate Backup Plus 8TB HDD (not SSD) connected to usb3
  • HDD uses NTFS file system than Linux native etx4
  • Uses SMB3 protocol
There are many guesses or options people are talking about on the internet, from converting NTFS to ext4 to buying a dedicated NAS device, etc...Let us go the scientific debugging route.

Hypotheses

Slow HDD access

There is a bottleneck in the connection between HDD and the RasPi.

Testing

There is a utility called hdparam in Linux to test the connectivity. Below goes the result.

Status

Rejected as it is showing better numbers.

Slow network connection

Due to the WiFi 5, it is slow in communicating between machines

Testing

There is a utility called iperf3 to test the network speed.

iperf3 to local network
iperf3 test to a public server

Result

The hypothesis is true that connectivity is the bottleneck. Either upgrade to use WiFi 6 which RasPi 4 doesn't support out of the box as well as most of my machines.

Next steps

Have some way to connect the RasPi and possible machines via ethernet cable. The wiring may be required.

Tuesday, July 13, 2021

Setting up home NAS - Part 4 - Raspberry Pi to build locally redundant NAS for home

This is the 5th post in the "Setting up home NAS" series. Below are the previous posts. It is not required to read previous posts to understand this. But that gives some background on this series.

Introduction

I was running below model for the home NAS system. My main contributor is the video category. My DJI Osmo Pocket produces high-bitrate videos. Also the RAWs.
  • Primary
    • A router attached USB drive working as NAS. \\192.168.1.1\share. It is of 1TB capacity
    • Sync the files to my personal computer that has a 500GB drive. So effectively getting only 500GB which are backed up. SyncToy is working fine for on-demand sync
  • Secondary (after publishing to YouTube)
    • Combine all the raw videos to single and upload to YouTube in private visibility
    • One back up to another external disk that has 2TB.
    • That means during editing time, 2 copies are in the router attached USB drive and personal laptop. After publishing, one uploaded to YouTube and the other copy in the different 2 TB hard disk.
As the COVID-19 pandemic slowed down and places got opened, I got chances to visit more places. Meaning more files to primary storage. One trip brings close to 10Gigs. The 500GB limit is almost reached its 3/4th capacity.

Problem

All my previous posts were explaining a problem and a solution. Every time a new problem. This time it is again going to reach the capacity and I had to do something to increase NAS storage space. As always I need two copies of files to be kept. Not an enterprise-grade NAS.

Requirement

This time I did some requirement engineering. Its nothing but looking at the past on how much data I was generating and forecasted how much more I would be in 

Below are some facts I could see
  • After I bought DJI Osmo Pocket there are a lot of videos coming out from trips
  • One trip produce 10GB on average
  • There are around 1.5 trips avg we are making per month. ~15GB
  • We shoot some videos at home as well. 2.5-3 GB
  • Adding the above + a buffer of 2GB ~ 20GB per month ~ 240GB/year ~ 1200GB/ 1.2TB for 5 years
    • Buffer is required for technical video downloads and anything which may come on our way.
  • There have to be 2 copies resulting in 2,400 GBs. But once published one backup is in YouTube itself with visibility private. So the final requirement is 1.8TB
There can be 2 systems similar to what I have now. Once published the videos can be moved to secondary.

Options

Is it time to think big or just add more drives? My YouTube channels are still in it's infancy. No hope to get monetized in the near future. The google ads revenue from Blogs is just enough to renew the https://joymononline.in site.

If I spend more and I lose interest in YouTubing, there will be trips but just photos coming out from those. Photos can easily be stored in 2 places by using Google Photos and one hard drive.

Currently, I have one more 1TB internal hard disk which is taken from the personal laptop when it was upgraded to SSD. Total of 1 TB hard disks x2, 2 TB hard disk x 1, and 500 GB on a personal laptop.
Below are the options I could find 
  1. RaspberryPi 4 or a similar low-powered device. Connect 1 TB hard drives to it and use as primary. Secondary continue as it
  2. Dedicated NAS device.
  3. Build a server machine by sourcing refurbished parts.
  4. Store in the cloud. OneDrive/Google drive etc...
If the budget is not a constraint, I would be going with the cloud option only. 

Solution

Finally decided to go with RaspberryPi 4. Below are the rationale
  • Its low power
  • It can be used for something else
    • If I lose interest in Youtubing which reduces the data generation.
    • If the OneDrive or Google Drive drastically reduce their price for me to afford for 2TB.
    • If our total family income increases and gets more budget to tech things cloud storage would be affordable. Yes, we do some family budgeting on the expenses. It is a big topic on its own
  • I am already planning to learn Linux and would like to learn the shell way. Why don't I learn with my own problems?
  • To advance my career, I would like to learn more about enterprise IT concerns. Dealing with my own problems would be a good starting point
  • Obviously, my requirement of 1.8TB for the next 5 years can be satisfied with this setup. The only problem would be the slow publishing of videos which causes more videos to stay in primary storage which has only 1TB capacity.
The architecture would be similar to what I am using now
  • Primary storage
    • 1TB connected to RPi, expose as \\SMB shared path
    • Backup 1TB attached to the router. 
    • Daily sync RPi connected the drive to the router attached one
    • We will be seeing why can't I just connect 2 HDDs to RPi 4 which has 2 USB 3 ports
  • Secondary
    • Same setup as of now

Home NAS using Raspberry Pi

Finally, we are discussing the business. Let us see what are the decisions, steps and issues faced.

Decisions

There are some decisions to be made

Size of RPi

The RPi 4 comes in different sizes based on the RAM. Many users say it requires only 2 GB to run as NAS. 8GB would definitely be overkill. So settled on 4GB RPi

Powered USB Hub

This is more electrical than setting up something. The very basic is any electrical equipment needs a power source. When we connect the hard disk to RasPi via a USB port, the power source of the HDD is RasPi. If RasPi cannot provide enough power to the HDD, it cannot function normally. We know the voltage is 5V but that is not all. We need to understand the maximum Watt requirement of HDD during its operation. Rotational Disk-based HDD requires the highest power to start spinning up. RasPi should be able to give that power though it may require less power during operation. In order to connect the dots, we need to consider the current as well which is measured in Amperes often noted in devices using either A or Amps or mA (milli Amps). Below is the relation that we learned in school.

W = VA

or

W=V*A (just for developers)

If one device specify W and V and another device specify V and A we can kind of do this calculation to see whether they match up 

Specs

It's time to read specs that nobody likes. RasPi specs say all 4 USB devices can together draw 1.2A of current. We know the voltage is 5V. So the max Power that can be given out through all the USB ports is 1.2 * 5V = 6W

In my case, I have 2.5" a laptop drive which has a requirement of 1.2Amps during spin up and an operational requirement of .8Amps. Meaning I can connect only one HDD to the RasPi directly at a time without an external power source. If I need to connect both the HDDs to RasPi, I would require a USB hub that has its own power source. Or buy another external HDD that is powered by a separate adapter.

This is the reason why I had to still connect my backup HDD of primary storage to the router. The router has enough power to drive HDD.

RPi OS

There are many operating systems available for RasPi. Even we can have Windows using its IoT Core edition. But decided to go with Raspberry Pi OS (Rasbian) as that is targeted to this device.

HDD FileSytem

Prefer to go with NTFS than Linux native Ext format. The main reason is in case RasPi fails I can connect the HDDs to my personal windows laptop. Planning to slowly migrate to Linux by starting with USB Linux installation with persistence storage.

Sync method

Our aim is to have one HDD connected to RasPi and another HDD to router and sync them. One more decision to be made is how to sync these 2 HDDs. There are 2 options I could find though they are not for solving the same issue and mutually exclusive.

  • RAID

There are already articles available on how to set up. Here is one good article on the same. I don't recommend this approach as this is mirroring. As soon as we do a change, it's replicated. No way to get the old copy in case we accidentally delete something.

  • RSYNC

This is a utility command which can sync 2 folders. The command has to execute to get the sync to happen. We can schedule easily during off-hours. Since it's home use, any time starting at 1 AM is fine. But the time depends on how your family members use the system.

There are disadvantages as well. If we copy something in the morning then in the afternoon primary hard disk failed. We lose the data as the sync happens only the next day at 1 AM. Also, if we accidentally delete something and we recognize it next week, there is no way to retrieve it.

I decided to go with this approach. Below is the link
https://www.howtogeek.com/139433/how-to-turn-a-raspberry-pi-into-a-low-power-network-storage-device/

Steps to get NAS up and running from RPi

These steps are mainly based on the article above in the RSYNC section. But there are some additional steps. Only the deviations and issues faced are documented rest of this article. Better to read the above article before reading further.

Let us start with something, not in that article.

Setting time zone

When we set up for the first time, the timezone would be the UK hence the time. If the location is not in the UK, it is better to change the time zone. Changing the timezone will update the time accordingly. I am not adding the step here as it's simply obtained by google.

Mount points

The tutorial mentioned above already has an instruction to install the NTFS driver. That has to be done before mounting the NTFS formatted drives. 

There are 2 mountings to be done. 

First mounting the USB drive connected to RasPi. To check the USB drive detected or not, use the below command

Tuesday, April 27, 2021

Azure @ Enterprise - Mind map of Azure Virtual Machines

Below is the mind map created as part of preparing for the AZ-303 exam.

This is created using PlantUML that helps us to code diagrams. Checked into the GitHub. PRs are welcome.

Tuesday, April 28, 2020

Setting up home NAS - Part 1 - Scientific debugging to get USB drive visible as \\share in network

Introduction

One of the previous posts was about scientific debugging and a template for debugging notes. The scientific approach really shines when we have to pause and resume the debugging. 
This is one live example where it is applied not necessarily in code debugging but fixing an issue with the home router

The requirement was to set up a home NAS. There are many ways to make it. A detailed post on home NAS would be coming in the future as part 2. One way is to set up a poor man's NAS like system is by connecting a USB drive to the home router if the router supports it. Nothing fancy. No high availability. Just a backup mechanism.

This post is to discuss one problem faced during the setup. 
After connecting the USB drive, the corresponding share is not getting visible to Win 10 machines.

Debugging a router problem would not be interesting to the readers of this blog as the majority are developers. But this gives a good example of how to follow scientific debugging which guarantees an output.

Solutions in internet

Optimum is the internet connection provider here but their connection guide doesn't have anything on it. Then checked the D-Link DIR-868L router page. That also not talking about any specific than marketing works. Then read the support page of the router. It has some more details including how to connect USB. But there is no special step mentioned. Just connect a USB drive and navigate to \\Router IP

Scientific debugging

Since its lockdown and debugging with kids (5 and 2 years) is extremely difficult as continuous troubleshooting is not at all possible. So I decided to follow the scientific debugging using the template created earlier. It is in gist and embedded below.

Tuesday, December 10, 2019

Networking for developers - Mind map of tools and commands

This can be considered as the second part of a previous post on Networking for .Net Web Developers. The textual version of tools and commands is not that intuitive to use. Here we have a mindmap of networking concepts, tools, and commands for debugging basic networking related issues.

Click on the image to see the SVG version of the same. SVG supports clicking hyperlinks.

An interesting thing here is that this diagram is also created using PlantUML and kept in GitHub. URL below.

https://github.com/mind-maps/software/blob/master/debugging/windows-network-debugging.puml
Feel free to issue a PR, in case of suggestions and additions.

How to set up an environment for editing PlantUML can be found here.

Tuesday, August 27, 2019

Networking for .Net Web Developers

It is a common scenario web developers have to deal with networking issues. Sometimes they surface as functional issue, security or performance issue. If they have the background of computer science study stream, they are expected to know how the computer network works. But most of the developers in the software industry don't have computer science major. Also, even if they are, they might not have practical knowledge of networking. This is talking about mass development consulting scenarios not the product development companies where there are a lot of filtering during the interview. Quora has a question on whether the web developer should know the networking concepts.

However, when a developer grows into the technical lead then architect positions they should know how the network works. So it is better to start understanding the networking at the earliest.

Below are some concepts and tools with a simple description. The tools are either inbuilt in OS or completely free.

Tools & commands

Browser F12

This is the first place to look. Just press F12 button to open the developer tools in the browser. All modern browsers support the developer tools. It helps to identify how many resources downloaded to render a web page, the time-taken, and size for each request finally errors in JavaScript execution. It also helps to understand the time browser spent for rendering after the resources are downloaded.

Fiddler

This is acting as a proxy between browser and web server. The scenarios which are difficult to identify via Browser F12 tools can be found using Fiddler.
eg: If we want to simulate the presence of header or want to understand http compression is really present we can use fiddler

Wireshark

This is a little more advanced tool but comes with more power to analyze at low-level.

TCPDUMP

This a tool for collecting network dumps from production machines where Wireshark is not available. 

NETSTAT

This shows the current statistics of network connections. Inbuilt with Windows Os.

Resource monitor

Resource monitor tool in Windows OS can also show the connection stats. Open Resource Monitor and goto the 'Network' tab to see the network statistics

Logs

Let's look at the logs what we need to be aware of when troubleshooting network issues. The advantage here is that we can look at what happened. The monitoring tools above mostly shows what is the current situation.

Web server / IIS logs

It is better to start with the server logs which says what were the URLs users requested from the system and how the system responded.

Http.sys logs
FREB - This is IIS feature where we can see how the IIS pipeline executed the individual request. Good for troubleshooting authentication issues.

EventViewer

This is an excellent place for seeing what happened over time at the system level. There are inactive log sources that we can enable if the issue is not reproducing on-demand and expecting it will reproduce later in time.

Protocols & standards

Below is a list of protocols and standards to be aware. This is a growing list and applicable based on each application's nature. They operate at different layers of network communication. 

Must have

  • UDP
  • TCP/IP
  • HTTP
  • HTTP/2
  • SSL/TLS 1.2
  • SQL - TDS

Nice to have (as applicable to our application)


  • Authentication - OAuth, OIDC, Kerberos, NTLM
  • Files - FTP, SMB
  • Mail - SMTP

HTTP standards

These are some common standards HTTP has though they are not really low-level networking.
  • Caching headers
  • ETag
  • HTTP Compression 
  • Content-Types
  • Mime-Types

Courses

https://www.udacity.com/course/networking-for-web-developers--ud256

Conclusion

This is not a comprehensive list. It covers only the tools in Windows OS. The tool names may be different if the development platform is different.

Tuesday, August 13, 2019

System.Diagnostics logging in .Net - Trace sources

As developers, we often need to work with network issues. The first step is to finding out there is a network issue such as delay or package loss. This can be found by looking at Wireshark. But Wireshark needs some expertise. Also, it needs installation and mostly a restart after installation. When working in production environments it would be difficult to restart. But the other side is we can analyze without any changes to the application as setting diagnostics source needs application config changes.
But if we just consider the expertise needed for Wireshark, a better way is to collect some svc logs using Diagnostics. If required go for Wireshark as the second step of the analysis.

Diagnostics sources related to Network

We are not going to create another list. Below are the links to already existing tutorials

General networking

https://docs.microsoft.com/en-us/dotnet/framework/network-programming/how-to-configure-network-tracing
https://blogs.msdn.microsoft.com/waws/2017/03/14/how-to-get-a-system-net-trace-of-your-c-web-job/

WCF

Legacy ASMX

Other diagnostic sources

Since diagnostics source tracing is .Net feature, there are other diagnostics sources as well useful in different scenarios. Below are some collections.

https://stackoverflow.com/questions/2464071/what-is-the-list-of-trace-sources-supplied-by-the-net-framework

Unfortunately, it seems there is no official link of the full list of trace sources.

Tuesday, July 30, 2019

Angular + ASP.Net WebAPI Application Performance Optimization - Index and Mind map

This is an index of things which needs to be checked, for performance optimization of a simple ASP.Net + Angular application. The simple application refers to application which read and write to SQL Server. If the application uses some other data store, still the points about other aspects are valid.

The details of each item would be either a link to posts in this blog or link to other resources. If someone is struggling to find where to start or struck on an optimization exercise,hope these questions will light a bulb in their brain. Sorry to say that it is very difficult to find an algorithm which applies every performance optimizations.

Browser side

  • Do we need to support desktop and mobile browsers?
  • Any possibility to avoid Internet Explorer and support only modern browsers:)
  • Do we have separate mobile site with URL or same site is controlled via bootstrap or similar display technique
  • Static assets
    • Are those cached? If not can we cache?
    • If those are cached what is the cache expiry?
    • If those are cached how its done? cache-control or Expires header? Is the cache really working?
    • Is the server properly returning http 304?
    • Are they minified and bundled?
    • Are the images optimized to have small foot print? 
    • Are they served from CDN?
  • Angular best practices applied?
  • If it is AngularJS, what is the feasibility to upgrade to Angular

The network

DNS and routing

  • Hows the DNS resolved to IP?
  • Is the application available public or accessed only via enterprise intranet?
  • What is the network connection band width between clients and server? also between web servers and database server(s)

Network devices

  • CDN
    • Any option for warming up cache?
  • Security / Application Gateways which open packets and scan for attacks.
    • What is the time needed for security inspections? Is it fast, if we bye pass gateway for testing?
  • Network load-balancer
    • Do we have load balancer? Are we reached the height of optimization and need scale out or scale up? In Azure, the best practice is to use LB as the machines gets patches and restarts periodically. Also follow the best practices to group machines so that all of those will not be restarted same time.
    • What is the algorithm used for load balancing?
    • Do we have sticky session need?
  • Common
    • Do we have logs available from these devices?
    • Are the logs enough to confirm that the backing web server is taking time to respond?

Web Server machine

  • Does the requirement of project is practical to the server? eg: One quad core, 8GB VM may never support 100,000 concurrent users even if its a simple company static web site
  • Is the machine / hosting infrastructure in Azure or any cloud? If so do all the best practices followed and coded by considering cloud principles such as retry pattern?
  • What is the status of CPU, Memory, Network etc.. during load test or busy hour?

IIS

  • Logging
    • Does the logging (time-taken field) says requests are taking high time? Please note that that time includes server processing + data transfer
    • Are we logging any custom field which are big in size?
    • Are the extra logging such as failed request tracking enabled?
    • During a load test of busy session
      • If we go to IIS worker process screen are we able to see many requests pending?
      • What is the http queue length performance counter shows ?
      • Are we able to identify one or sub set of requests taking high chunk of processing time other than rest of requests? This can be done by analyzing IIS logs.
  • Static assets - Kind of repetition from previous section. 
    • Are they cached properly?
    • Are we using ASP.Net Bundling or compile time bundled? Are they served in minimized form
    • Can we increase cache expiry?
  • Protocols
    • Any possibility to leverage http/2, if not done?
    • Is it using web sockets?
  • Authentication
    • Is it using windows authentication? If so NTML or Kerberos? Kerberos is recommended for better performance
  • AppPool Recycling 
    • What is the AppPool recycling settings? 
    • Is the recycling causing delay?
    • Any ways to run mock requests so that the cache is populated before real user hit application?
  • Throttling / Limiting
    • What is the MaxConnection Setting and other IIS level throttling?
    • Are there any performance counter showing connections getting queued and rejected?
  • Timeouts
    • Is there any manual test and load test attempted by reducing the timeouts to lowest possible settings? Some times high timeouts cause some requests to occupy entire system resources
  • Payload
    • Does the http compression enabled

ASP.Net Application

ASP.Net pipeline till our code

  • What are the throttling settings at different level?
  • Are there any custom HttpModules which may reduce performance? Any unwanted modules?

Our code

  • Are there anything which can be cached instead of going every time to database? eg: any reference tables which change only by deployment.
  • Are there any retries happening and succeeding after lot of attempts? Try reducing retry count to 3.
  • Are there static variable usage and any potential for lock contention and memory leaks?
  • Are the locks applied to lowest possible code section?
  • JSON optimization
    • Can the property names be shortened?
    • Are the default values serialized into JSON?
  • Are we doing any HTML rendering at server and returning as JSON property? Any possibility to make application as pure client rendered SPA?
  • Do we have high amount of reflection?

.Net General

  • Are there high amount of GC collections? This can be found from analyzing performance counters?
  • What is the fragmentation level in LOH?
  • Can we do NGEN?
  • Any memory leaks in the application? eg: open connections, unwanted static things which may hold objects?

Database

  • Does the applications logs showing that the queries are taking time?
  • Does the SQL setup with possible best practices? eg: temp db, flags, connection limiting etc...
  • Are there any subset of SPs always slow?

Mind map

Finally, there is a mind map created using PlantUML for easy reference. Since this is kept textual in GitHub and rendered on demand, this would be living document than the post.

Details on how to get PlantUML working is available in different post including a YouTube video tutorial.

Other similar links

Tuesday, June 25, 2019

Network capacity planning - Poor developer's tool

Background

We are about to perform load testing of a our application using a load testing tool say Visual Studio Team System or load runner. Before we initiate we need to plan the network capacity needed for full load. If the load testing environment is in a locked room air gaped with rest of network, this is not an big impact. But it is good to know, if we are running load test in same enterprise network with users and especially running the during the peak business hours. It looks wired but some people actually does this way.

Lets assume our application is simple web based single page application with some web apis. Both hosted in same web server(s)

Aim

Find out the total network payload between 2 machines/IPs for a specified time interval. This can be used to measure traffic to the application when load test scenarios are executed.

In this post, we are taking http://joymononline.in as the application to test

Tools

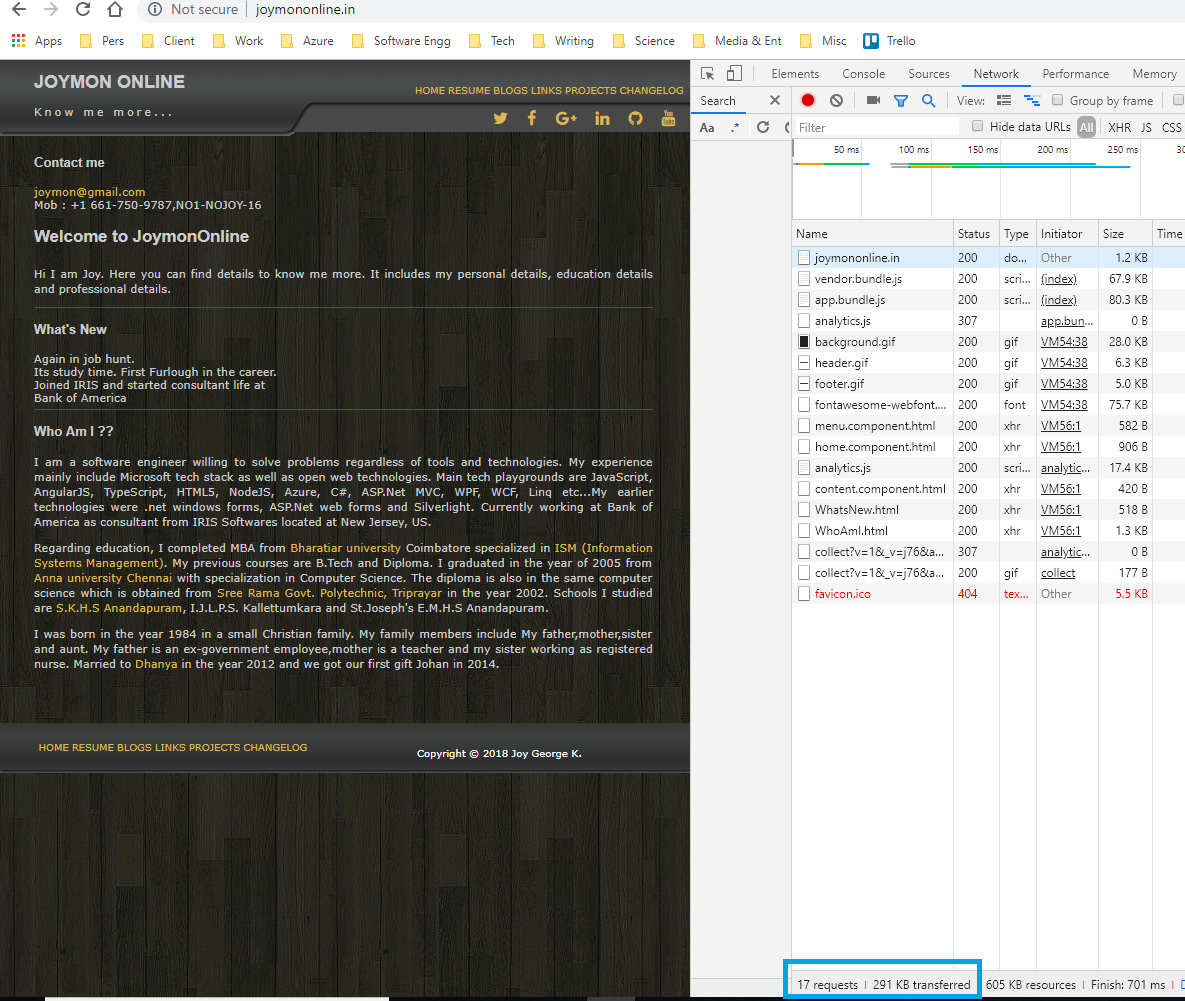
There are lot of tools. F12 can be seen as one. But F12 is not enough as it capture the http traffic. Other than http data, there are lot of handshaking and all happening to establish connection. 

Apart from http data size 291KB what is shown in above screenshot, we need to find out actual traffic.
Lets see how this can be done using Wireshark. 

How to measure using Wireshark

First we need to find out the IP of the application. In this scenario we can taking http://joymononline.in as the application to load test

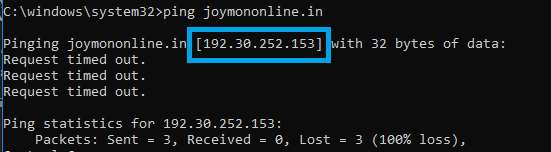
Finding the destination IP address

Simple if the target server supports ping. Below is a screenshot which does the same

Wireshark statistics

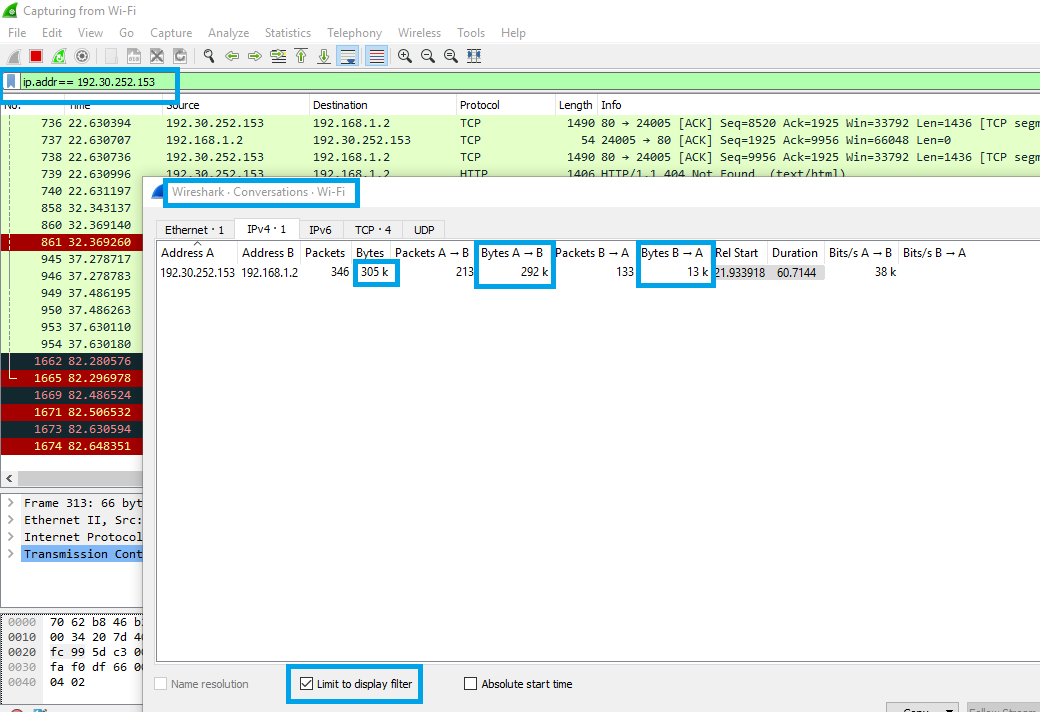
Wireshark has Statistics menu, that can show the conversations happened between 2 IPs. 

Below are the steps

  1. Run Wireshark. Make sure selecting the right network adapter. In this case its from Laptop with home broadband connected via WiFi.
  2. Filter the traffic by entering proper filter
  3. Do the operations. In this case just opened http://joymononline.in in browser
  4. Pause Wireshark
  5. Open Statistics->Conversations
  6. Check the "Limit to display filter" checkbox at the bottom left.
  7. Select IPv4.1 tab. (It really depend on the scenario what needs to be captured)
The Bytes shows total bytes transferred. in this case 305k the Bytes A->B and Bytes B->A shows the directional communications.

Measure traffic in load test scenario

In the real scenario to measure the traffic, the full scenarios / use cases of load test can be executed with single user once the Wireshark runs. If there are load generating agents, the Wireshark has to run there to capture traffic.

Interesting

Tuesday, June 4, 2019

SQL Server Browser Service - a view through wire

What is SQL Server Browser Service

It is a windows service which helps the clients by providing information about SQL Server instances running in the machine. For example, if a client knows only SQL instance name say server1\namedInstance2, the SQL Server browser helps the client to find the exact port number of named instance. Port number is needed to connect to the to the SQL Server Engine if it is using TCP to connect and uses non standard 1433 port.

How SQL Server Browser works?

SQL Server Browser works over UDP port 1434. It doesn't seems we can change that UDP port as it defeats the purpose of endpoint discovery. In short clients ask information about SQL Instance and browser service answers it.

Refer the Microsoft documentation for more details.

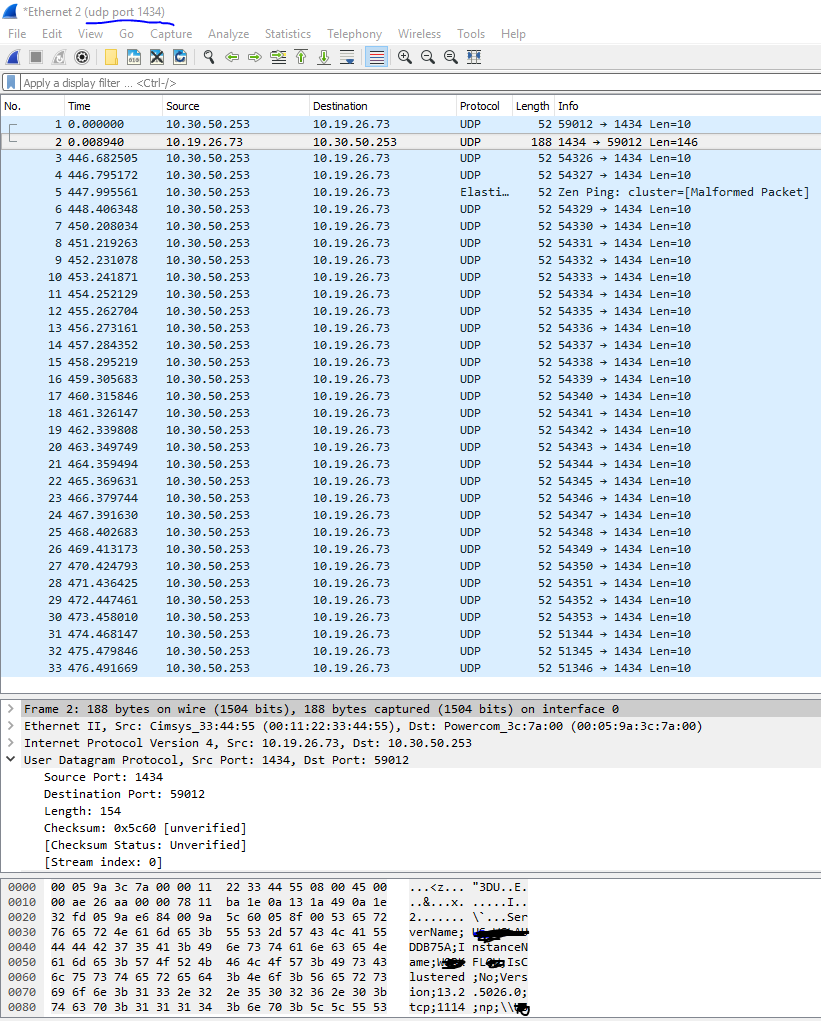
How SQL Server Browser looks like from Wireshark?

SQL Server browser activities can be seen through wire, if we have right network tools installed. Wireshark is the best tool to begin with and its widely popular for these type of exploring. It is free to use. There is already a great article which shows how it works over the wire. Link is below


It is assumed that the application to SQL Server communication would be via TCP as normally  as best practice applications and databases are placed in different machines. If the named pipes or shared memory is used, the troubleshooting will vary.

Wireshark to see SQL Server Browser failure

Normally on development environment the 1434 port would be open and SQL Server Browser running in SQL Server machine. If developers code based on that assumption, it may fail in higher environments. Most of the developers know what might have happened. But some may not and ends up in complete darkness. The symptom of this issue will be connection failure from application to SQL Server database.

This post is mainly to demonstrate how to check network failures on SQL Server Browser operations. The prerequisite is the availability of Wireshark in the machine where application runs and basic knowledge how to run the same. The above link has some screenshots which would help to run Wireshark for UDP connections.

The failure scenario can be confirmed by below steps.

  1. Make sure the Wireshark is capturing UDP 1434 traffic in the machine where application runs.
  2. Reproduce the scenario. Better use SSMS or any test client tools to establish a connection than full application. Again if allowed to use SSMS or other tools in higher environments.
  3. If the UDP requests are made one after another like retry, there is an issue. Refer the screenshot below from the frames starting 3. The initial 2 frames shows the working scenario.
  4. The UDP will fail, if any of the below is true.
    1. The firewall rules blocks the port 
    2. The SQL Server Browser is not running in the SQL Server machine.

If the everything is in working state and the client application is not using specific TCP port to connect to SQL Server Instance, the client will get UDP response from server with the port number. Else it retries 30 times and times out.

We can easily filter the Wireshark logs if we already knows what is the SQL Server machine IP Address. The source would be the SQL Server machine IP and the destination application machine IP.

Caching the port number by client applications

The clients may cache the TCP port number what they got from UDP response. In such scenario based on the nature of the client, we may need to restart or wait for the cache expiry.

Similarly The SQL Server Browser might be stopped or communication is blocked in any other ways, during the normal working. If it happens, the old clients works but new clients don't. It is better to restart the clients to ensure there is connectivity.

https://stackoverflow.com/questions/53906521/where-is-the-cache-of-sql-server-browser-service-for-resolving-instance-names-p

References

https://docs.microsoft.com/en-us/sql/database-engine/configure-windows/troubleshoot-connecting-to-the-sql-server-database-engine?view=sql-server-2017
https://social.msdn.microsoft.com/Forums/sqlserver/en-US/d234c318-dead-4aab-bd2d-7c0cd8f4261a/sql-browser-and-1434-in-sql-server-2016?forum=sqldatabaseengine
https://www.mssqltips.com/sqlservertip/2436/what-does-my-sql-server-data-look-like-over-the-wire/

Tuesday, November 6, 2018

PowerShell to find the listening port and its process - eg SQL Server Analysis Service

Problem

Enterprise environment always enforce security in different levels. One such level is network ports. There will be less questions when we want to open port 443 for http(s) communication. Also it is fine if the ports are familiar such as 1433 for SQL Server. But when it comes to some unfamiliar ports its difficult. Also they wants to open very minimal ports. So finding and documenting exactly what ports are required is a considerable job for an Architect. This is obviously not applicable to Architects who are there when solutions or define the solution themselves. But its trouble for Architects who reverse engineer what is in the development / testing / staging environment and prepare document which is essential to move the application to the higher environment.

One such thing is SQL Server Analysis Service. For SQL Server OLTP engine its easy to find out. But for analysis service, its difficult if the installation is done using custom port.

What Google says

This is not the first time people encounter the problem and there are lot of solutions to it. Some from google are below.

To find ports and processes in general

http://blogs.microsoft.co.il/scriptfanatic/2011/02/10/how-to-find-running-processes-and-their-port-number/
https://stackoverflow.com/questions/42857466/find-process-that-is-blocking-a-port-on-windows

https://superuser.com/questions/1215093/powershell-one-liner-to-show-process-on-same-line-as-port-using-netstat-issue

Find SSAS Ports

https://support.microsoft.com/en-us/help/2466860/how-to-determine-and-change-the-port-of-an-ssas-instance
https://www.cisco.com/c/en/us/support/docs/conferencing/telepresence-management-suite-analytics-extension/112506-pqa-112506-00.html#q1

The general scripts are either based on long custom PS command or text analytics based. The SSAS port findings required 2 steps to figure port out.

Easy solution using PowerShell

Below is another one which does the things in singe PS command. Yes obviously there is piping and we can argue whether its multi-line script or not.

Finding ports and processes


Get-NetTCPConnection | `
where {$_.State -eq 'Listen'} | `
select -Property LocalAddress, `
                        @{name="Process";Expression={$psid = $_.OwningProcess; (Get-Process | where {$_.Id -eq $psid }).Name + ', ' + $_.OwningProcess}}, `
                        LocalPort ` |
sort -property Process

Pretty much straight forward. It relies on the Get-NetTCPConnection commandlet. Then does some filtering and selection to get the list back.

Finding port of SSAS Service

We can apply the above technique easily to filter the SSAS process

get-nettcpconnection | `
where {$_.State -eq 'Listen'} | `
where {$_.OwningProcess -in (Get-Process | Where {$_.Name -eq 'msmdsrv'}).Id} | `
Select-Object -Property LocalAddress, `
                        @{name="Process";Expression={$psid = $_.OwningProcess; (Get-Process | where {$_.Id -eq $psid }).Name + ', ' + $_.OwningProcess}}, `
                        LocalPort `


It takes a big assumption that the process name of SSAS is 'msmdsrv'. In future Microsoft change the name the script will not work.

References

Tuesday, July 17, 2018

Starting Scala Spark - Streaming via TCP network socket in Windows

This is a simple tutorial about basic Scala Spark word count via streaming. There are so many samples for achieving this same. Then why this post?

One reason is all the posts are talking about how it works in Linux machines. Very rarely we find posts where the authors are using Windows machines. Another reason is to simplify the code to be understandable by a Scala beginner such a proper names for reduceByKey(_+_) which is very difficult to understand at first. Lets get started.

Spark

The code is pretty much straight forward as given below.

package org.apache.spark.examples.streaming

import org.apache.log4j.{Level, Logger}
import org.apache.spark.SparkConf
import org.apache.spark.streaming.dstream.ReceiverInputDStream
import org.apache.spark.streaming.{Seconds, StreamingContext}

// Counts words in input stream.
object SparkStreaming_HdfsWordCount {
  def main(args: Array[String]) {
    //Initialization
    Logger.getLogger("org").setLevel(Level.ERROR) //Remove the noise which is useful sometimes
    var master = "local[2]" //Change to have immutability. Helps to run easily in local machine ans cluster mode.
    args.sliding(2, 2).toList.collect {
      case Array("-master", arg: String) => master = arg
    }
    val sparkConf = new SparkConf().setAppName("HdfsWordCount").setMaster(master)
    // Setup streaming
    val ssc = new StreamingContext(sparkConf, Seconds(10))
    val lines:ReceiverInputDStream[String] =ssc.socketTextStream("localhost",8081)
    val words = lines.flatMap(_.split(" "))
    val wordCounts = words.map(word => {
      //println(x) //Debug purpose. Can see individual word
      (word, 1) // 1 means one instance of word.
    }).reduceByKey((x,y) => x + y) //Summing

    wordCounts.print() // Display the output

    ssc.start()
    ssc.awaitTermination()//Wait
  }
}

Some changes are done from the standard sample versions during troubleshooting. If we create a sample project in IntelliJ IDE for Spark, we can get streaming program which has file location as stream source. It might be little tedious to get the File system working in windows machines such as prefixing file:// or file:/// and the confusion over backslash or front slash etc...So better to use the network as source

If the environment is setup right, running the above program will try to connect to localhost:8081 and process the network stream.

PowerShell

The above Scala code make connection to port 8081 in localhost. But where is the server? Server means the producer of events into stream. If we look at normal posts they talk about a utility called nc which can be used to generate contents into the stream. 

But that is a Linux specific utility named netcat (nc). Though there are some equivalent available in Windows, it may be little difficult to get things working unless we download the binaries from known or unknown sites. For simplicity lets have the producer in PowerShell

$port=8081
$endpoint = new-object System.Net.IPEndPoint ([system.net.ipaddress]::any, $port) 
$listener = new-object System.Net.Sockets.TcpListener $endpoint
$listener.server.ReceiveTimeout = 5000

$listener.start() 

try {
    Write-Host "Listening on port $port, press CTRL+C to cancel"

    While ($true){

        if (!$listener.Pending())
        {
            Start-Sleep -Seconds 1;
            continue;
        }
        $client = $listener.AcceptTcpClient()
        #$client.client.RemoteEndPoint | Add-Member -NotePropertyName DateTime -NotePropertyValue (get-date) -PassThru

        $id = New-Guid
        $data = [text.Encoding]::ASCII.GetBytes("joymon $id")    $client.GetStream().Write($data,0,$data.length)
        "Sent message - $date - $(get-date)"

        $client.close()
   }
}
catch {
        Write-Error $_       
}
finally{
            $listener.stop()
            Write-host "Listener Closed Safely"
}

This is again straight forward. Inside a loop it wait for incoming connection. Once the connection is established, it will send messages suffixed with a GUID. The GUID is for making sure all the messages are reaching to the Spark streaming. The PowerShell code is mainly composed from these link1 & link2. Thanks to the authors. Just copy paste the code to PowerShell ISE and run.

The real time scenarios could be really complex than this word count. But this will give us an idea how the Spark Streaming works.

Tuesday, June 26, 2018

Azure @ Enterprise - Finding the usage of vNet and Subnet IPs

There is a common myth that networking is easy in Cloud environment. At least considering Azure ,its is not true. If we are in Enterprise and want to implement security at the networking level we have to deal with vNets, subnets and their associated rule mechanisms such as NSG and much more. If it is a small deployment, there will be less confusion about vNet and subnets inside that and how many IPs used and free etc...Even re-balancing subnets even easy.

But that may not be the situation in an Enterprise where so many systems or departments share one subscription or same networking infrastructure. Things may often go out of control and will end up in situation where there are no more IPs or subnets for new applications.

The first challenge is to identify the usage of current vNets and Subnets inside them. We can get the details from Azure portal but its difficult if we want to consolidate to one view to take actions.

Below is a simple script to list down what are the subnets inside a particular vNet and how many IPs are possible and how many are used

Get-AzureRmVirtualNetwork -Name <Name of vNet> -ResourceGroupName <Name of vNet's RG > `
| Get-AzureRmVirtualNetworkSubnetConfig `
| Sort -Property Name `
| Select -Property Name, `
                   AddressPrefix, `
                   @{Name='Available IPs';Expression={[Math]::Pow(2,32-$_.AddressPrefix.split('/')[1])}}, `
                   @{Name='Used IPs';Expression = {$_.IpConfigurations.Count}}

Please note it shows the possible IPs not displayed as an integer instead as CIDR notation. If we are familiar to networking, we can easily understand how many IPs are available excluding the reserved IPs in Azure, what is the start IP and end IP etc... There are lot of hosted tools available to interpret the CIDR notation.

Once we knew there are issues such as vNets are fragmented, we have to think about solutions. We can easily suggest to change the policy to allot a vNet per department or system or application. There are trade offs in both the approaches.  If we allocate big vNet to a department and they don't have enough applications, all those will be unused. Also all departments need experts to manage the networks. The decision has to be made case by case.

Happy Networking...

Tuesday, May 1, 2018

Azure @ Enterprise - Finding Subnet of HDICluster via PowerShell

Enterprise love putting resources into virtual network(vNet) thinking that, it brings certain high level of free security via isolation. HDInsight clusters can also be put into vNet. What to do if we have a HDICluster which is added to Subnet earlier and we don't know the Subnet name now?

Silly question. Isn't it? Just go to portal and see the cluster properties. That is what below MSDN article says.
https://docs.microsoft.com/en-us/azure/hdinsight/hdinsight-administer-use-portal-linux#list-and-show-clusters

Unfortunately our corporate subscription is only showing vNet name in the properties not Subnet. So how to get the Subnet name?

Finding Subnet of HDICluster

Powershell help us here. Below goes the script

$hdiClusterName = "POC001Joy"
$hdiCluster = (Get-AzureRmHDInsightCluster -clustername $hdiClusterName)
$resourceProperties =(Get-AzureRmResource -ResourceId (Get-AzureRmHDInsightCluster -clustername $hdiClusterName).Id).properties
$resourceProperties.computeProfile.roles[0].virtualNetworkProfile.subnet

It simply gets the object of HDInsight resource and navigate to the required property. The object model is little confusing but its there.

The above PowerShell script can be directly entered into Azure Portal or run after logging into Azure from PowerShell window / ISE.

An issue has been added to the MSDN documentation article related to this missing subnet name.

Enjoy Scripting...