When we do application development and hosting ourselves its an easy life. If something we miss, our nights and weekends are simply gone. A different kind of easy life. But what if we develop and someone else host and maintain? It adds additional efforts to bring both the parties into same page regarding root cause of errors, performance etc...
Most of the enterprise world works as 2 separate teams for development and hosting. One of the issue in syncing both operations and development regarding performance often arise is around the IIS logs. IIS logs shows 5 digits or 6 digits values in time-taken field. It may simply reach to development as application issue. Most of the administrators know time-taken field includes the network time to move the payloads along with execution time. But still there are admins who just pass over those issues to development without thinking what is going on the network devices, ActiveDirectory, security gateways and what not in the route.
If its clear and not expecting any of these type of issues from operation admins, please feel free to stop reading further on this post. This post is mainly intended to developers and admins who needs to know little in depth about the time-taken field and how to find the application processing time from the time-taken field.
Oh yes its simply to look at the IIS Failed Request tracing(FREB here onwards). Again feel free to stop reading as its simple as looking at FREB logs to find the network time separated from application execution time.
The below is for people who wants to reproduce a network delay and see what FREB shows. Truly for hands on enthusiasts.
Sample server application
The network delay mainly happens in below situations- If the payload is really large
- Security gateways placed between the user and servers to prevent attack takes extra time in inspecting packets or if the bandwidth is really slow.
- If the Active Directory or other identity providers which are placed before the application is taking time.
The test application which we are going to use has a simple web api as below.
http://localhost/TimeTakenTestServer/api/files/2
It gives random 2 MB text data back. The last number in the URL shows how many MBs of text to be returned. The WebAPI caches the random string so that subsequent requests don't need the time to generate the data. Its just reading from cache.
How to create such a request is out of this post. But for those who are interested can check out a sample in below repo location.
<Code location>
Simulate delay
Delay can be simulated in different ways.
Chrome F12 network profile
Chrome dev tools has option to introduce artificial delays. It can be used to create delays. But please note that this will not work for smaller payloads as it gets buffered in HTTP driver or IIS levels.
.Net app to slow reads using TCP API
If we use TCP classes in .Net, we can simulate delays. If we use higher level APIs, either they may not have the option to put delays or they might be reading from network level buffers.
Chrome F12 tools to demo the problem
Lets use Chrome to simulate delay. Below is the screenshot.
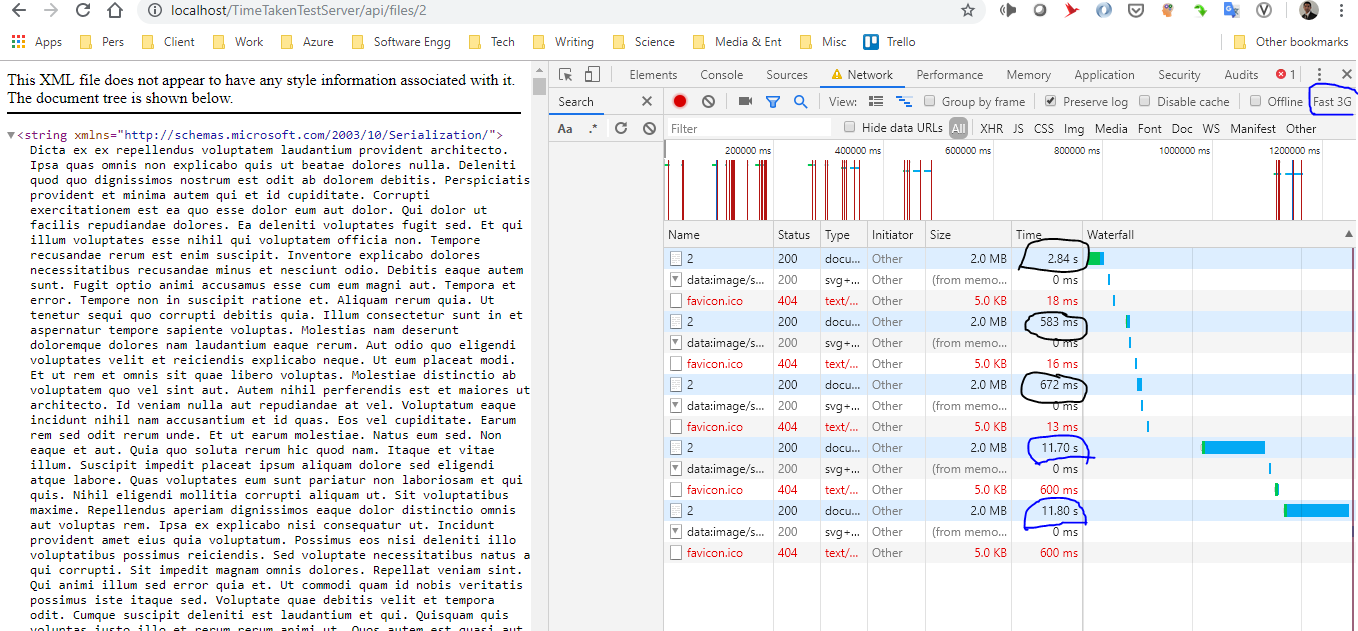
Chrome view
The first request is made after an IIS reset. It took around ~2 seconds. IIS needs some extra time to warm up the worker process after its reset. Note that the Fast 3G network throttle profile at the top left was no turned on at this time.
Then tried 2 Ctrl+F5 which clear browser cache and loaded again. But this time we can see that it completed in milliseconds. This is because the server is already up and running also it has the string in memory cache (in this case a static variable)
Then the Fast 3G network throttle profile is turned on. The subsequent requests took more time.
IIS log
Let us see what IIS says about this test.#Fields: date time s-ip cs-method cs-uri-stem cs-uri-query s-port cs-username c-ip cs(Referer) sc-status sc-substatus sc-win32-status time-taken
2019-05-21 23:23:14 ::1 GET /TimeTakenTestServer/api/files/2 - 80 - ::1 - 200 0 0 929
2019-05-21 23:23:17 ::1 GET /favicon.ico - 80 - ::1 http://localhost/TimeTakenTestServer/api/files/2 404 0 2 17
2019-05-21 23:23:21 ::1 GET /TimeTakenTestServer/api/files/2 - 80 - ::1 - 200 0 0 715
2019-05-21 23:23:22 ::1 GET /favicon.ico - 80 - ::1 http://localhost/TimeTakenTestServer/api/files/2 404 0 2 6
2019-05-21 23:23:24 ::1 GET /TimeTakenTestServer/api/files/2 - 80 - ::1 - 200 0 0 641
2019-05-21 23:23:27 ::1 GET /favicon.ico - 80 - ::1 http://localhost/TimeTakenTestServer/api/files/2 404 0 2 4
2019-05-21 23:23:39 ::1 GET /TimeTakenTestServer/api/files/2 - 80 - ::1 - 200 0 0 6389
2019-05-21 23:23:47 ::1 GET /favicon.ico - 80 - ::1 http://localhost/TimeTakenTestServer/api/files/2 404 0 2 3
2019-05-21 23:23:57 ::1 GET /TimeTakenTestServer/api/files/2 - 80 - ::1 - 200 0 0 6505
Note that the Chrome and IIS traces are not taken from exact same trial. But they are done without any changes.
FREB to rescue
Now lets see how can we understand that the transfer really took time or something wrong with application. FREB can be enabled for http 200 responses though it says failed request tracing. The FREB logs can clearly tell how much time it took for data transfer and it is displayed in the below image.
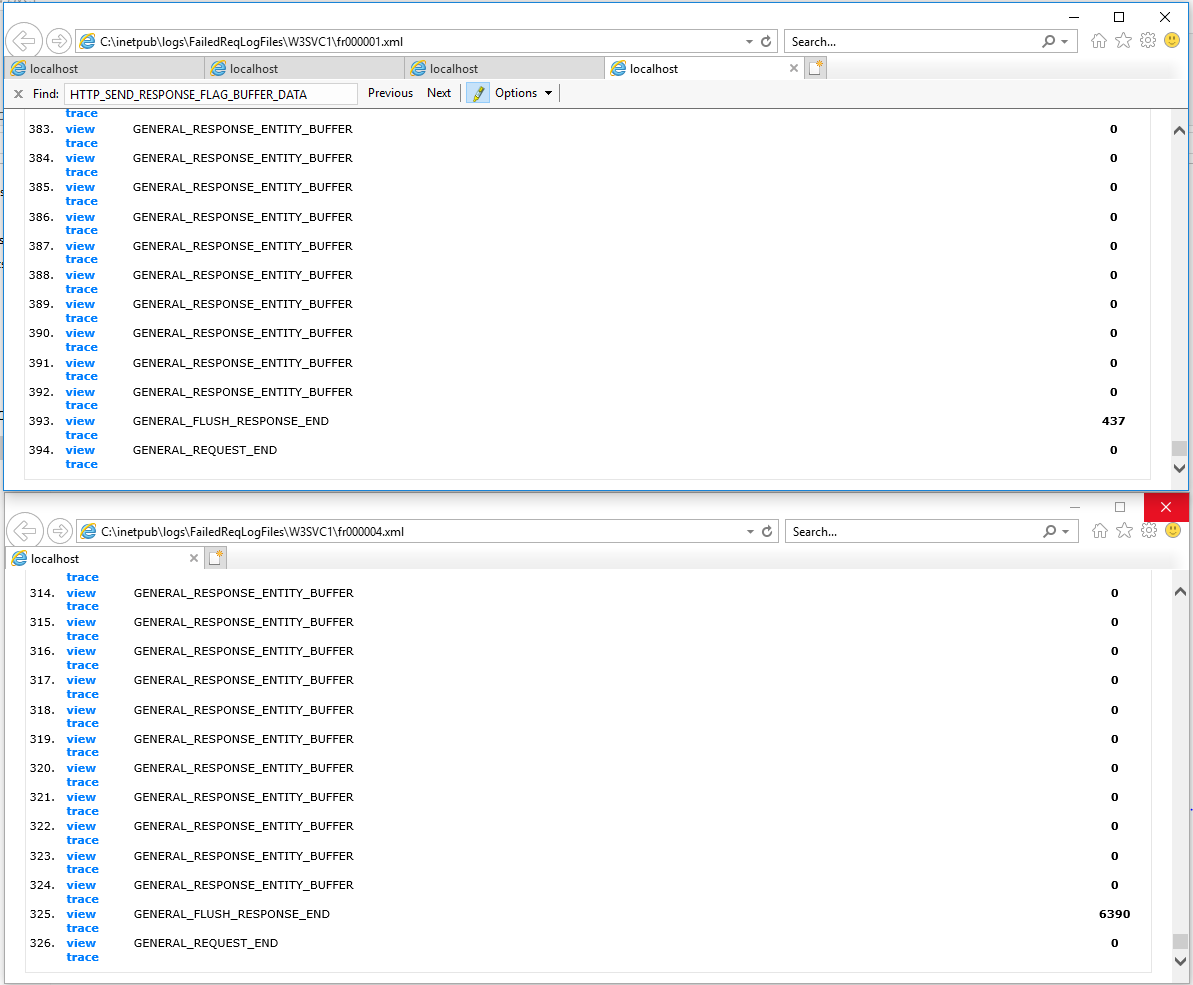
The above image shows the comparison of second request and the last request. The second one don't have any F12 Networking throttling but the last one has hence the transfer time is high.
More reading
HTTP.sys buffering at TCP layer
https://support.microsoft.com/en-us/help/820129/http-sys-registry-settings-for-windowshttps://blogs.msdn.microsoft.com/wndp/2006/08/15/buffering-in-http-sys/
Tool to simulate network delay
http://jagt.github.io/clumsy/index.htmlReferences
https://blogs.msdn.microsoft.com/tess/2008/08/19/troubleshooting-a-performance-issue-with-failed-request-tracing-and-appcmd-in-iis7/https://blogs.msdn.microsoft.com/docast/2016/04/28/troubleshooting-iis-request-performance-slowness-issues-using-freb-tracing/