Tuesday, June 25, 2019

Network capacity planning - Poor developer's tool

Background

We are about to perform load testing of a our application using a load testing tool say Visual Studio Team System or load runner. Before we initiate we need to plan the network capacity needed for full load. If the load testing environment is in a locked room air gaped with rest of network, this is not an big impact. But it is good to know, if we are running load test in same enterprise network with users and especially running the during the peak business hours. It looks wired but some people actually does this way.

Lets assume our application is simple web based single page application with some web apis. Both hosted in same web server(s)

Aim

Find out the total network payload between 2 machines/IPs for a specified time interval. This can be used to measure traffic to the application when load test scenarios are executed.

In this post, we are taking http://joymononline.in as the application to test

Tools

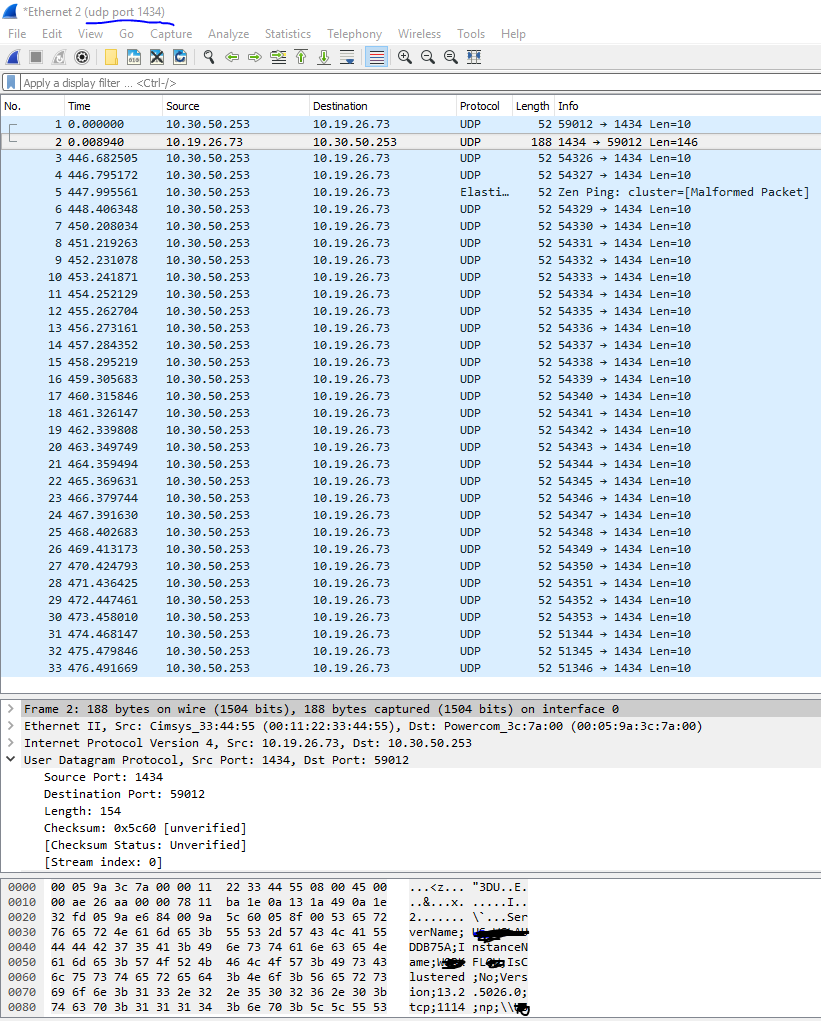
There are lot of tools. F12 can be seen as one. But F12 is not enough as it capture the http traffic. Other than http data, there are lot of handshaking and all happening to establish connection. 

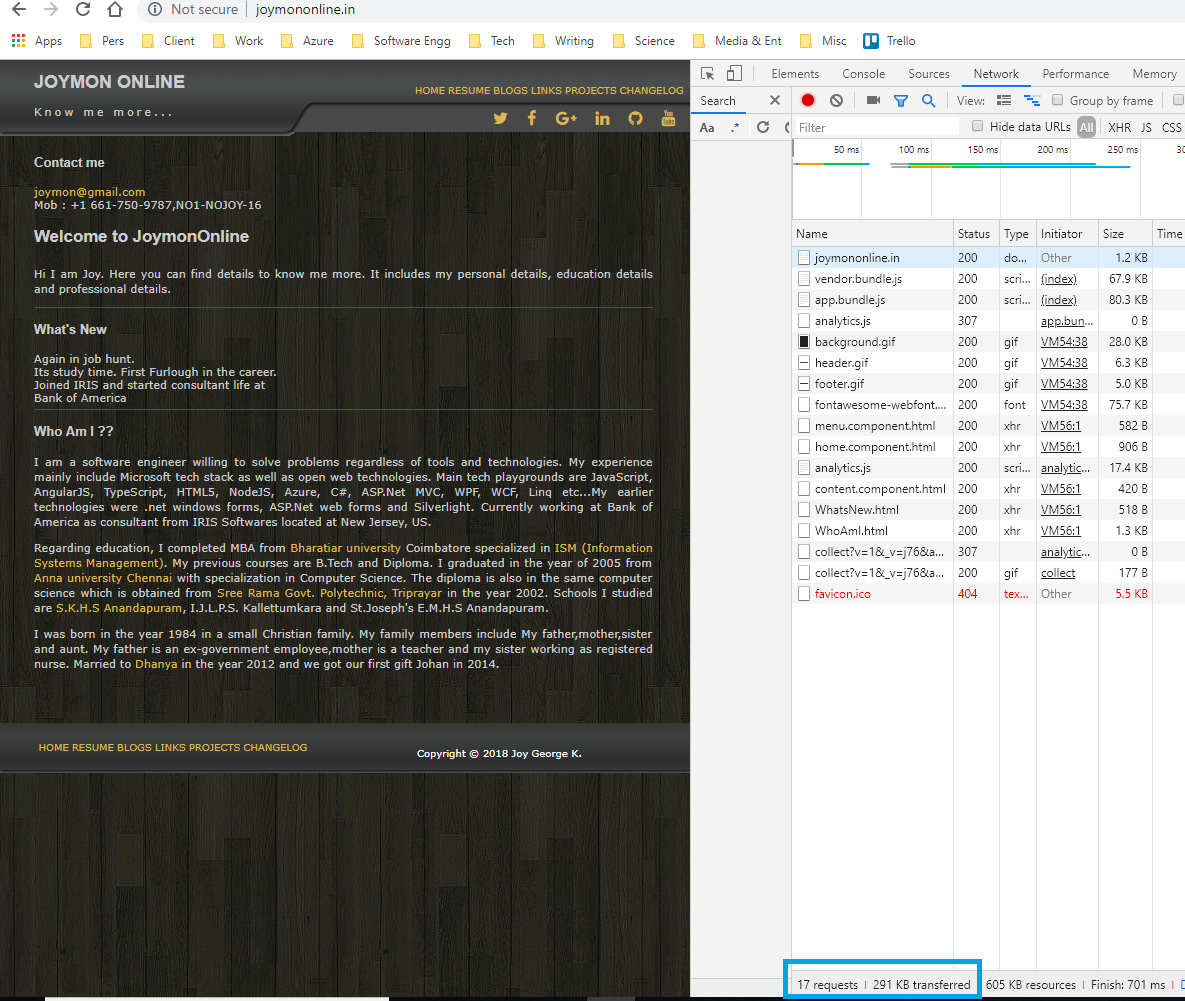
Apart from http data size 291KB what is shown in above screenshot, we need to find out actual traffic.
Lets see how this can be done using Wireshark. 

How to measure using Wireshark

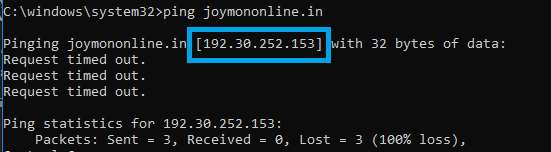
First we need to find out the IP of the application. In this scenario we can taking http://joymononline.in as the application to load test

Finding the destination IP address

Simple if the target server supports ping. Below is a screenshot which does the same

Wireshark statistics

Wireshark has Statistics menu, that can show the conversations happened between 2 IPs. 

Below are the steps

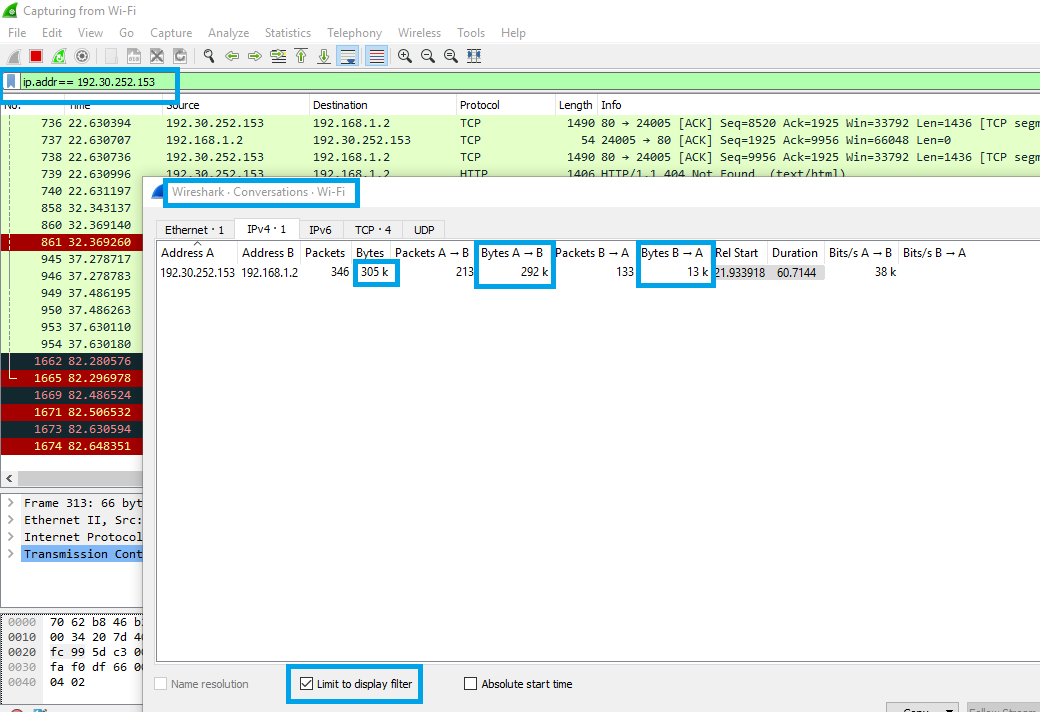
  1. Run Wireshark. Make sure selecting the right network adapter. In this case its from Laptop with home broadband connected via WiFi.
  2. Filter the traffic by entering proper filter
  3. Do the operations. In this case just opened http://joymononline.in in browser
  4. Pause Wireshark
  5. Open Statistics->Conversations
  6. Check the "Limit to display filter" checkbox at the bottom left.
  7. Select IPv4.1 tab. (It really depend on the scenario what needs to be captured)
The Bytes shows total bytes transferred. in this case 305k the Bytes A->B and Bytes B->A shows the directional communications.

Measure traffic in load test scenario

In the real scenario to measure the traffic, the full scenarios / use cases of load test can be executed with single user once the Wireshark runs. If there are load generating agents, the Wireshark has to run there to capture traffic.

Interesting

Tuesday, June 18, 2019

PlantUML - Code, Generate and Publish Mind-maps from GitPages

Introduction

This post mainly aims to provide an idea how we can use PlantUML to create mind maps and host them from GitPages without spending anything. It obviously need a computing device with browser and internet connection.

PlantUML

No need to have introduction again, as there were posts written earlier on the same. Just to summarize
  • It is a textual representation of diagrams.
  • Helps to version and compare changes applied.
  • Can render in different visual formats from the same textual definitions.

Mind maps

It is diagramming model where information about one concept is represented in relation with other related topics. More on Wiki.

Coding Mind maps

The setup explained in previous post is enough for coding mind maps. PlantUML supports mind maps out of the box in latest versions as beta.

Rendering diagram

Though the ideal way to publish into web is HTML, there seems some issues in generating HTML files out of the box. So better get it into image formats and embed into HTML using <img> tag. 

If we are using our machines during development, it is easy to have control over the environment and install GraphViz and Java runtime needed for PlantUML. Now a days everybody uses continuous integration and delivery method. The CI/CD environments with full control mostly require fees and here we are trying to achieve without any cost. Let is see how to get the diagrams published in free?

One way is to use containers where entire ecosystem would be present and use it in CI/CD environment. Another way which we are going to see is via proxy service of PlantUML

Using the proxy service is very simple. The official www.plantuml.com site has a service hosted in below url

http://www.plantuml.com/plantuml/proxy?src=<accessible URL to the plantuml file>

This src query string pair accepts a source url where the PlantUML code file is present and returns converted image representation.

eg:The below URL gives the png file corresponds to the PlantUML file located at the path mentioned in src query string parameter
http://www.plantuml.com/plantuml/proxy?src=https://raw.githubusercontent.com/mind-maps/software/master/debugging/before-debugging-others-problem.puml

More details on controlling the behavior can be found in this post.

The moment we got the png back via an URL, we can easily publish using html files. No need to have CI/CD systems and dealing with containers or build environments.

Publishing

GitPages provides free sub domain based web site hosting free and we can host mind maps directly from the GitHub repository. Using the markdown, we can easily convert the above mentioned url into an link <a> or <img> tag.

eg:A link in markdown file (.md) can be denoted as below

[Debugging](http://www.plantuml.com/plantuml/proxy?cache=no&src=https://raw.githubusercontent.com/mind-maps/software/master/debugging/before-debugging-others-problem.puml)

Sample repo

Source repo which hosts the puml files & hosting .md files - https://github.com/mind-maps/software
Sub domain & URL based web site which GitPages gives for repo- https://mind-maps.github.io/software/

The .md files gets automatically converted into HTML and served. If there is index.md it would be taken as default when we didn't mention anything in the url. GitPages internally uses Jekyll and customization can be done. One such customization in the above repo is in below URL. Since Jekyll and customization is not in the scope of this post, please google for more details.

Below are not essential but just to give complete picture
Sub domain based organization URL - https://mind-maps.github.io/
Repo of organization web site - https://github.com/mind-maps/mind-maps.github.io

Enjoy documenting...

Tuesday, June 11, 2019

.Net Server Performance - Important performance counters

The list of performance counters doesn't really a good fit to be inside a blog post. This is because it should be a living document. As and when we feel there is one more counter to be looked at we should add to the list. So its well suited as a gist which is easy to update than blog. Also someone interested can give pull request as well.

The main purpose of this list is to help collecting high level view about the performance of system. It may not tell which function or stored procedure is taking more time, but gives a view about where to start with. At least helps to determine whether to start from web server or database server.

This can be feed into an monitoring system such as Azure Application Insights for tracking the previous state. 

Tuesday, June 4, 2019

SQL Server Browser Service - a view through wire

What is SQL Server Browser Service

It is a windows service which helps the clients by providing information about SQL Server instances running in the machine. For example, if a client knows only SQL instance name say server1\namedInstance2, the SQL Server browser helps the client to find the exact port number of named instance. Port number is needed to connect to the to the SQL Server Engine if it is using TCP to connect and uses non standard 1433 port.

How SQL Server Browser works?

SQL Server Browser works over UDP port 1434. It doesn't seems we can change that UDP port as it defeats the purpose of endpoint discovery. In short clients ask information about SQL Instance and browser service answers it.

Refer the Microsoft documentation for more details.

How SQL Server Browser looks like from Wireshark?

SQL Server browser activities can be seen through wire, if we have right network tools installed. Wireshark is the best tool to begin with and its widely popular for these type of exploring. It is free to use. There is already a great article which shows how it works over the wire. Link is below


It is assumed that the application to SQL Server communication would be via TCP as normally  as best practice applications and databases are placed in different machines. If the named pipes or shared memory is used, the troubleshooting will vary.

Wireshark to see SQL Server Browser failure

Normally on development environment the 1434 port would be open and SQL Server Browser running in SQL Server machine. If developers code based on that assumption, it may fail in higher environments. Most of the developers know what might have happened. But some may not and ends up in complete darkness. The symptom of this issue will be connection failure from application to SQL Server database.

This post is mainly to demonstrate how to check network failures on SQL Server Browser operations. The prerequisite is the availability of Wireshark in the machine where application runs and basic knowledge how to run the same. The above link has some screenshots which would help to run Wireshark for UDP connections.

The failure scenario can be confirmed by below steps.

  1. Make sure the Wireshark is capturing UDP 1434 traffic in the machine where application runs.
  2. Reproduce the scenario. Better use SSMS or any test client tools to establish a connection than full application. Again if allowed to use SSMS or other tools in higher environments.
  3. If the UDP requests are made one after another like retry, there is an issue. Refer the screenshot below from the frames starting 3. The initial 2 frames shows the working scenario.
  4. The UDP will fail, if any of the below is true.
    1. The firewall rules blocks the port 
    2. The SQL Server Browser is not running in the SQL Server machine.

If the everything is in working state and the client application is not using specific TCP port to connect to SQL Server Instance, the client will get UDP response from server with the port number. Else it retries 30 times and times out.

We can easily filter the Wireshark logs if we already knows what is the SQL Server machine IP Address. The source would be the SQL Server machine IP and the destination application machine IP.

Caching the port number by client applications

The clients may cache the TCP port number what they got from UDP response. In such scenario based on the nature of the client, we may need to restart or wait for the cache expiry.

Similarly The SQL Server Browser might be stopped or communication is blocked in any other ways, during the normal working. If it happens, the old clients works but new clients don't. It is better to restart the clients to ensure there is connectivity.

https://stackoverflow.com/questions/53906521/where-is-the-cache-of-sql-server-browser-service-for-resolving-instance-names-p

References

https://docs.microsoft.com/en-us/sql/database-engine/configure-windows/troubleshoot-connecting-to-the-sql-server-database-engine?view=sql-server-2017
https://social.msdn.microsoft.com/Forums/sqlserver/en-US/d234c318-dead-4aab-bd2d-7c0cd8f4261a/sql-browser-and-1434-in-sql-server-2016?forum=sqldatabaseengine
https://www.mssqltips.com/sqlservertip/2436/what-does-my-sql-server-data-look-like-over-the-wire/